
Under NextGenerationEU, the European Commission issues green bonds to finance and refinance eligible green expenditure through the Recovery and Resilience Facility (RRF). For the 2024 reporting period the programme covers 5,705 projects and €264.85 bn in eligible expenditure. Of that, €88.04 bn was reported as spent in 2024 — roughly a third of the eligible expenditure.
Where the money is eligible to go, and which expenditure was reported by category in 2024, in € bn:
| Category | Eligible | Spent 2024 |
|---|---|---|
| Clean transport & infrastructure | 72.38 | 14.87 |
| Energy efficiency | 67.76 | 18.51 |
| Clean energy & network | 61.02 | 3.83 |
| Water supply & waste management | 21.43 | 1.52 |
| Research & innovation (green transition) | 20.57 | 2.53 |
| Other | 7.52 | 1.02 |
| Climate change adaptation | 7.30 | 1.39 |
| Nature protection, rehabilitation & biodiversity | 6.15 | 0.65 |
| Digital technologies (green transition) | 0.44 | 0.01 |
Programme bonds (ISINs): EU000A3K4DW8, EU000A3K4C42, EU000A3K4DG1, EU000A3K4DM9, EU00043K4EU0, EU00043K4DW8, EU00043K4DM9.
At programme level, this documents where green capital is meant to flow and which expenditure was reported. For investors, data providers, auditors and the other recipients of these reports, it often remains hard to trace how these funding flows actually take shape at specific locations.
For this data story we traced three EU-funded projects from the NextGenerationEU green-bond programme back to specific locations and checked them against satellite data from 2017 to 2025. The project file describes what was funded. The satellite imagery and measurement series show which changes are visible at the site.
The three cases show different evidence pictures: a visible discrepancy between project status and satellite finding, a clear confirmation, and a partial finding where the engineering is visible but the ecological development is not yet.
Key findings
- France: the demolition of the old factory is clearly traceable in the satellite data. New construction of the 25 social-housing units, however, is not detectable in the analysed imagery through to mid-2025.
- Spain: the extension of the Portodís hydropower station is visibly traceable at the site. The reported measure and the satellite finding are consistent.
- Croatia: the engineered landfill cap is visibly complete. The temperature and vegetation data, however, still show a warm, largely unvegetated surface. The engineering is thus traceable, the ecological regeneration not yet.
The analysis is based on deterministic remote-sensing measurements: Sentinel-2 spectral indices, ECOSTRESS land-surface temperature and topographic terrain data. It is not about AI interpretation, but about traceable measurement series that stay traceable from the raw acquisition through to the finding.
Where we looked
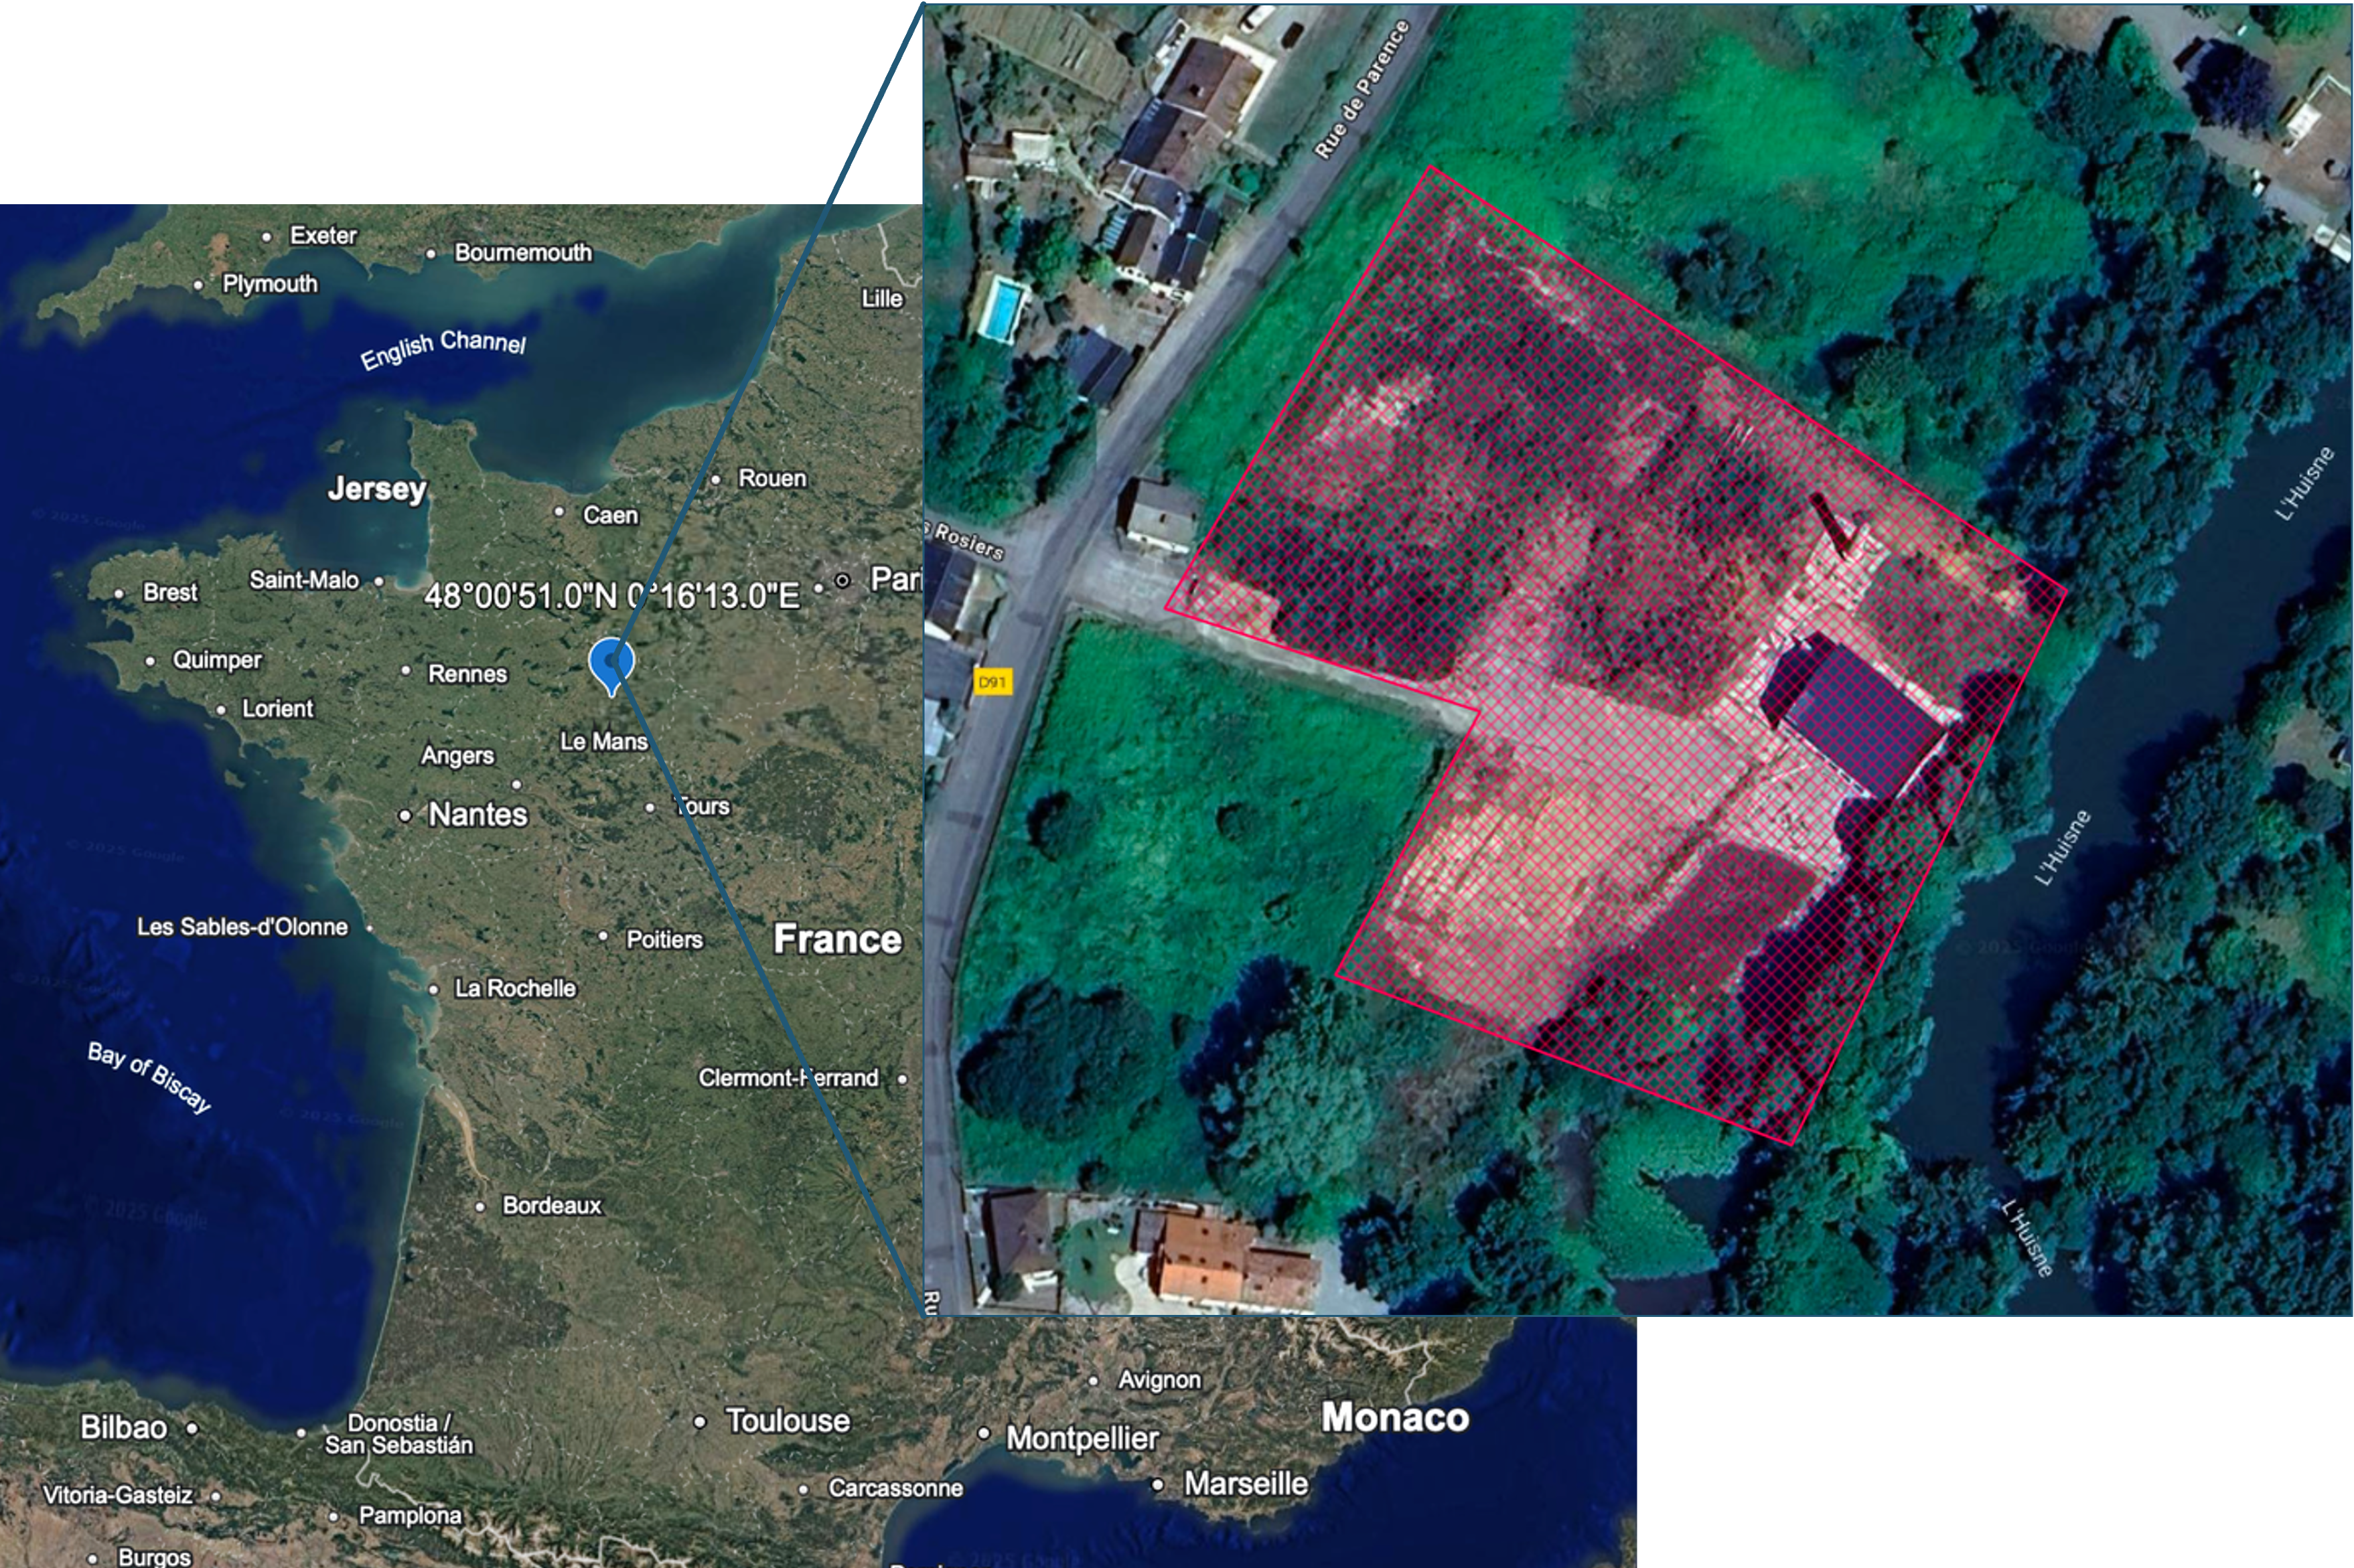
The three analysed sites were located to their exact coordinates: France, Spain and Croatia.
External content
CARTO
This content is loaded from an external provider. Doing so transmits your IP address to them. Nothing is requested until you choose to load it.
Location: 48°01′16.0″N 0°16′36.8″E
France — Yvré-l'Évêque, near Le Mans
Brownfield factory → 25 social-housing units · €1.7 M total, €610,000 from EU funds · 48°01′16″N 0°16′37″E
The project concerns the conversion of a former factory site on the bank of the Huisne into social housing. The project file has recorded the scheme as finished since spring 2023.
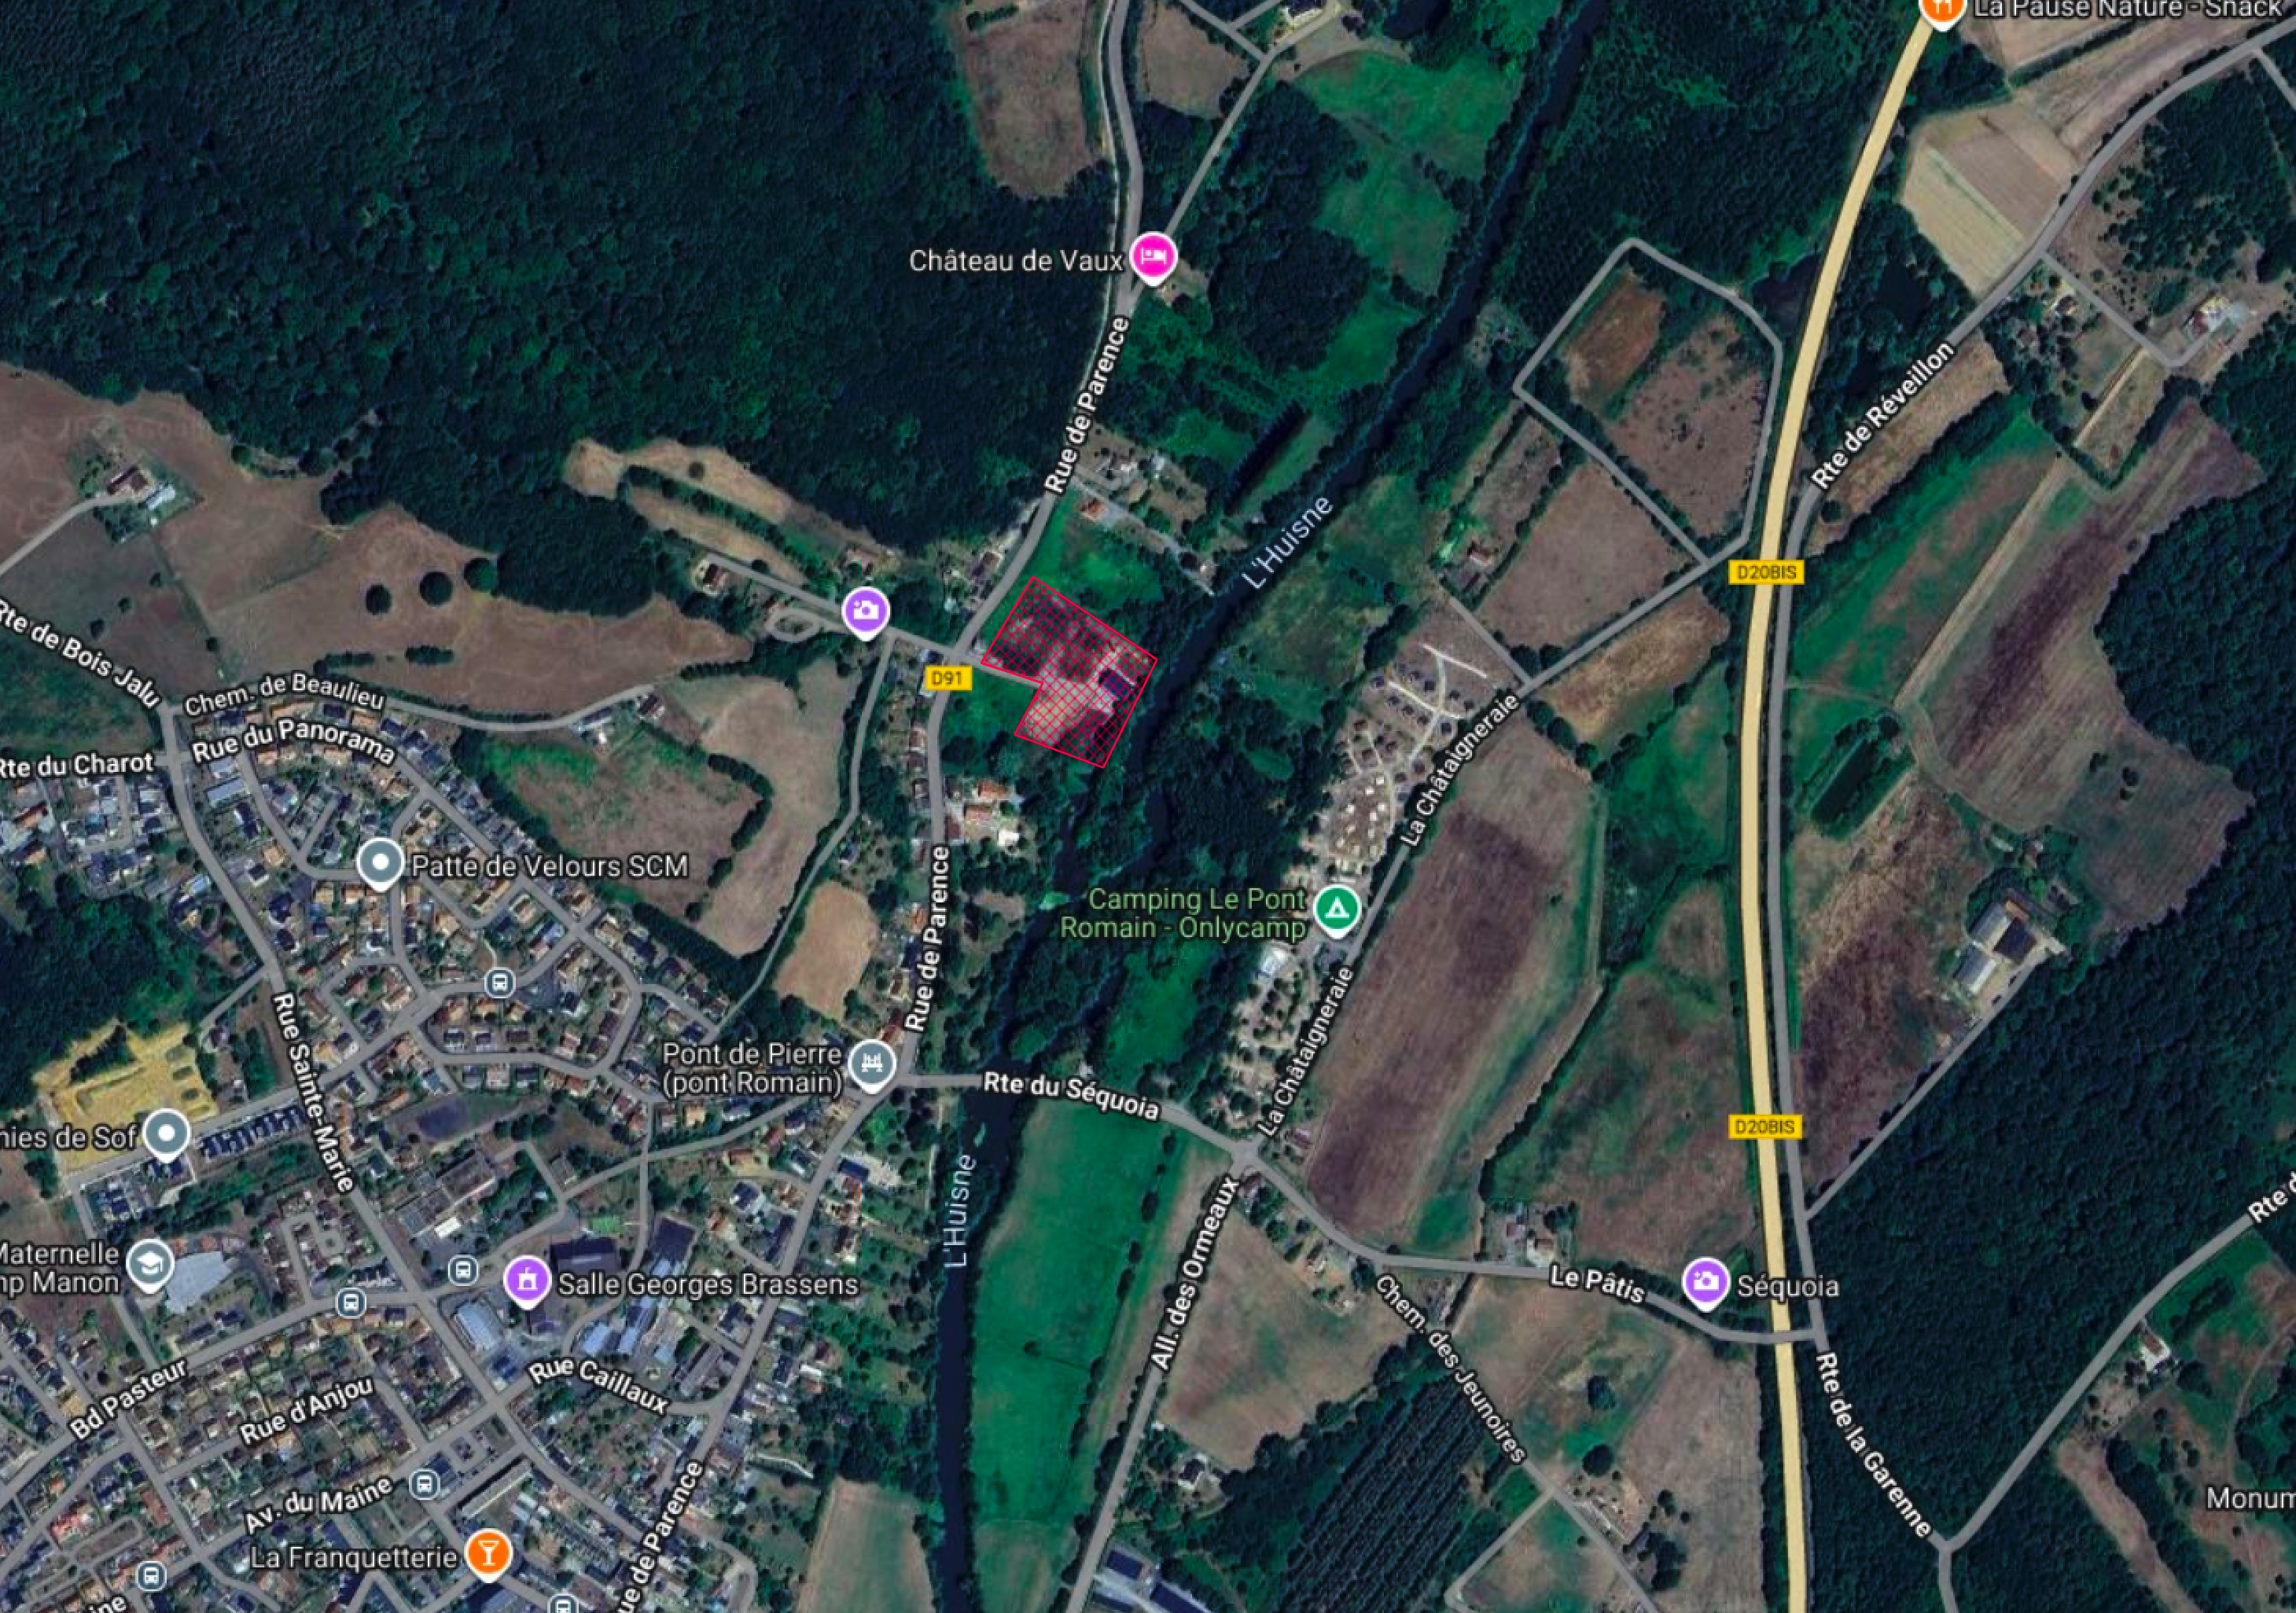
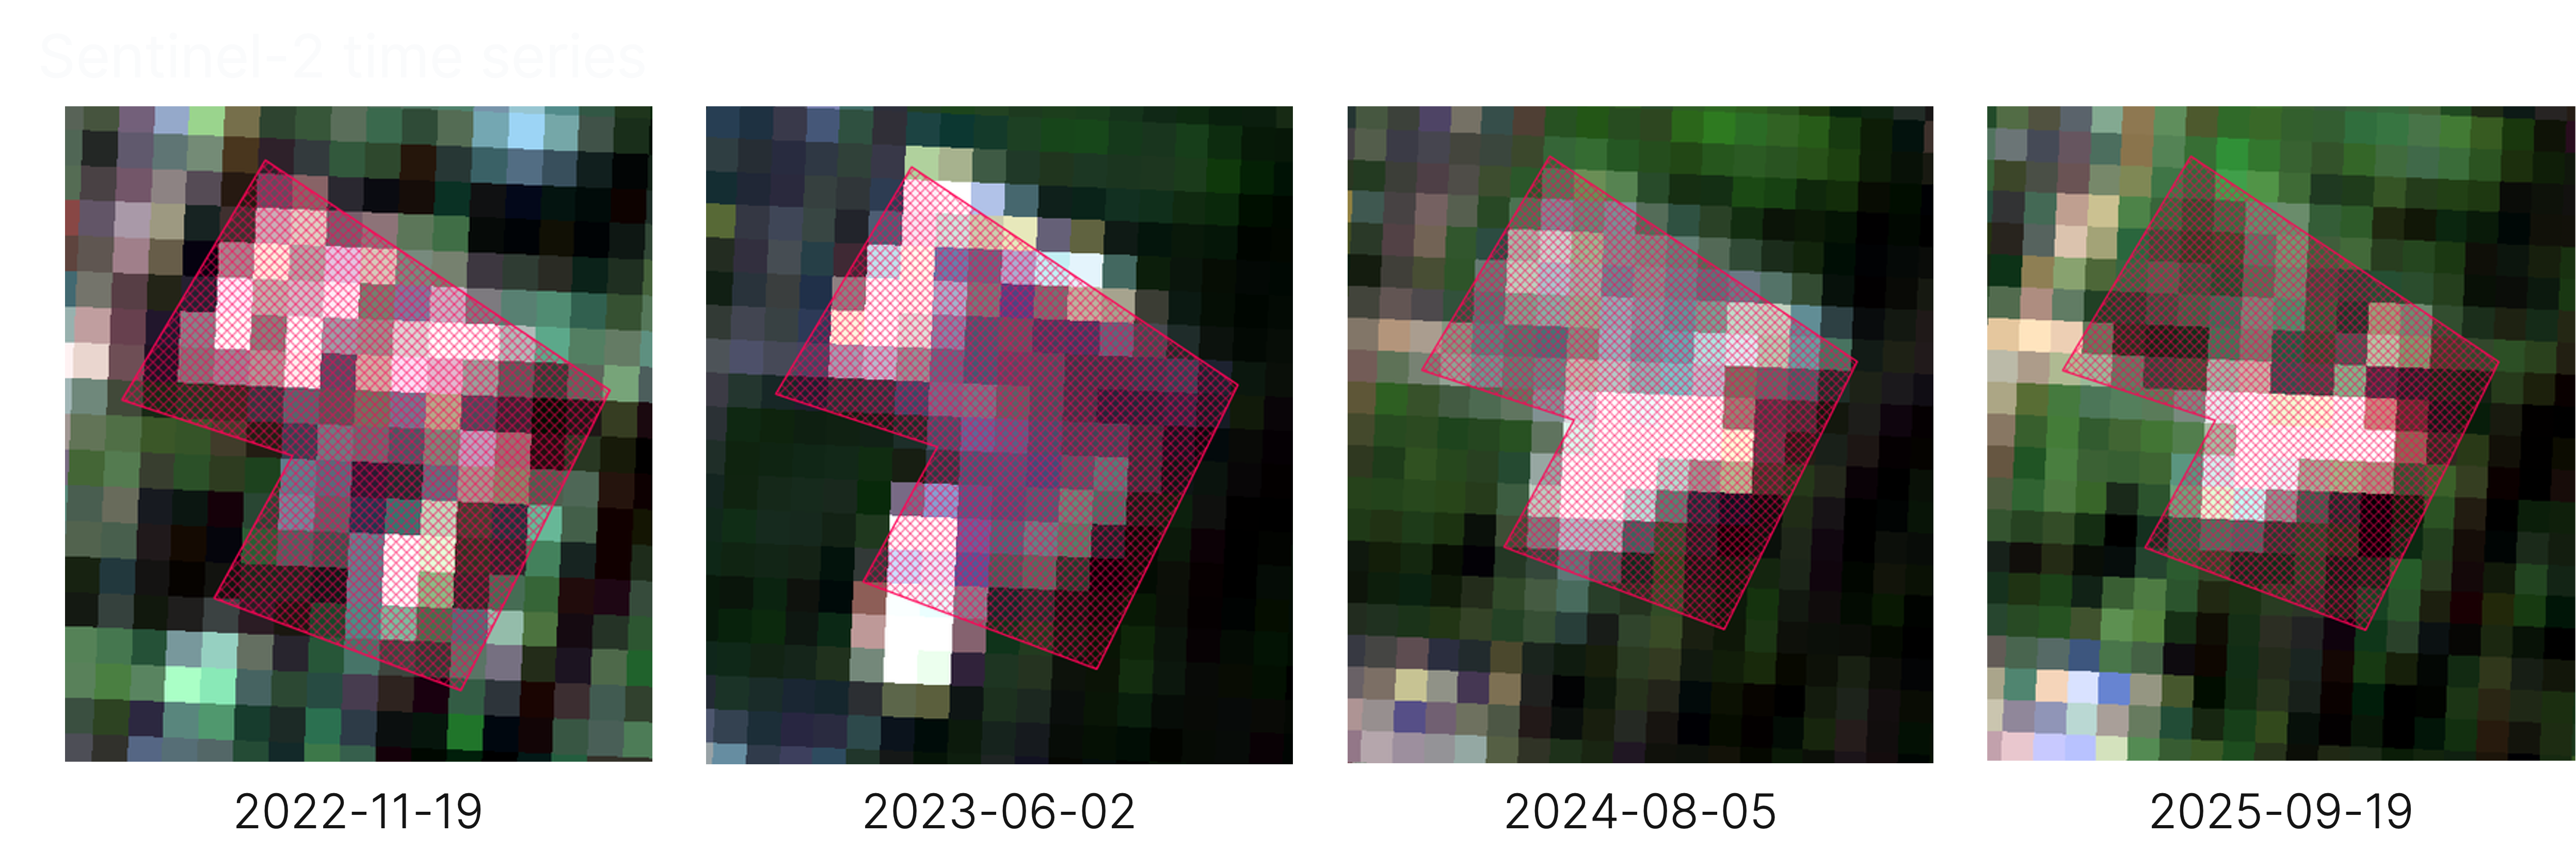
Two Sentinel-2 acquisitions, July 2022 and July 2025, bracket the change. In the first the factory is still visible. In the second the building is removed and the ground is cleared. In the analysed 2025 imagery, no new construction of the 25 social-housing units is detectable on the site.
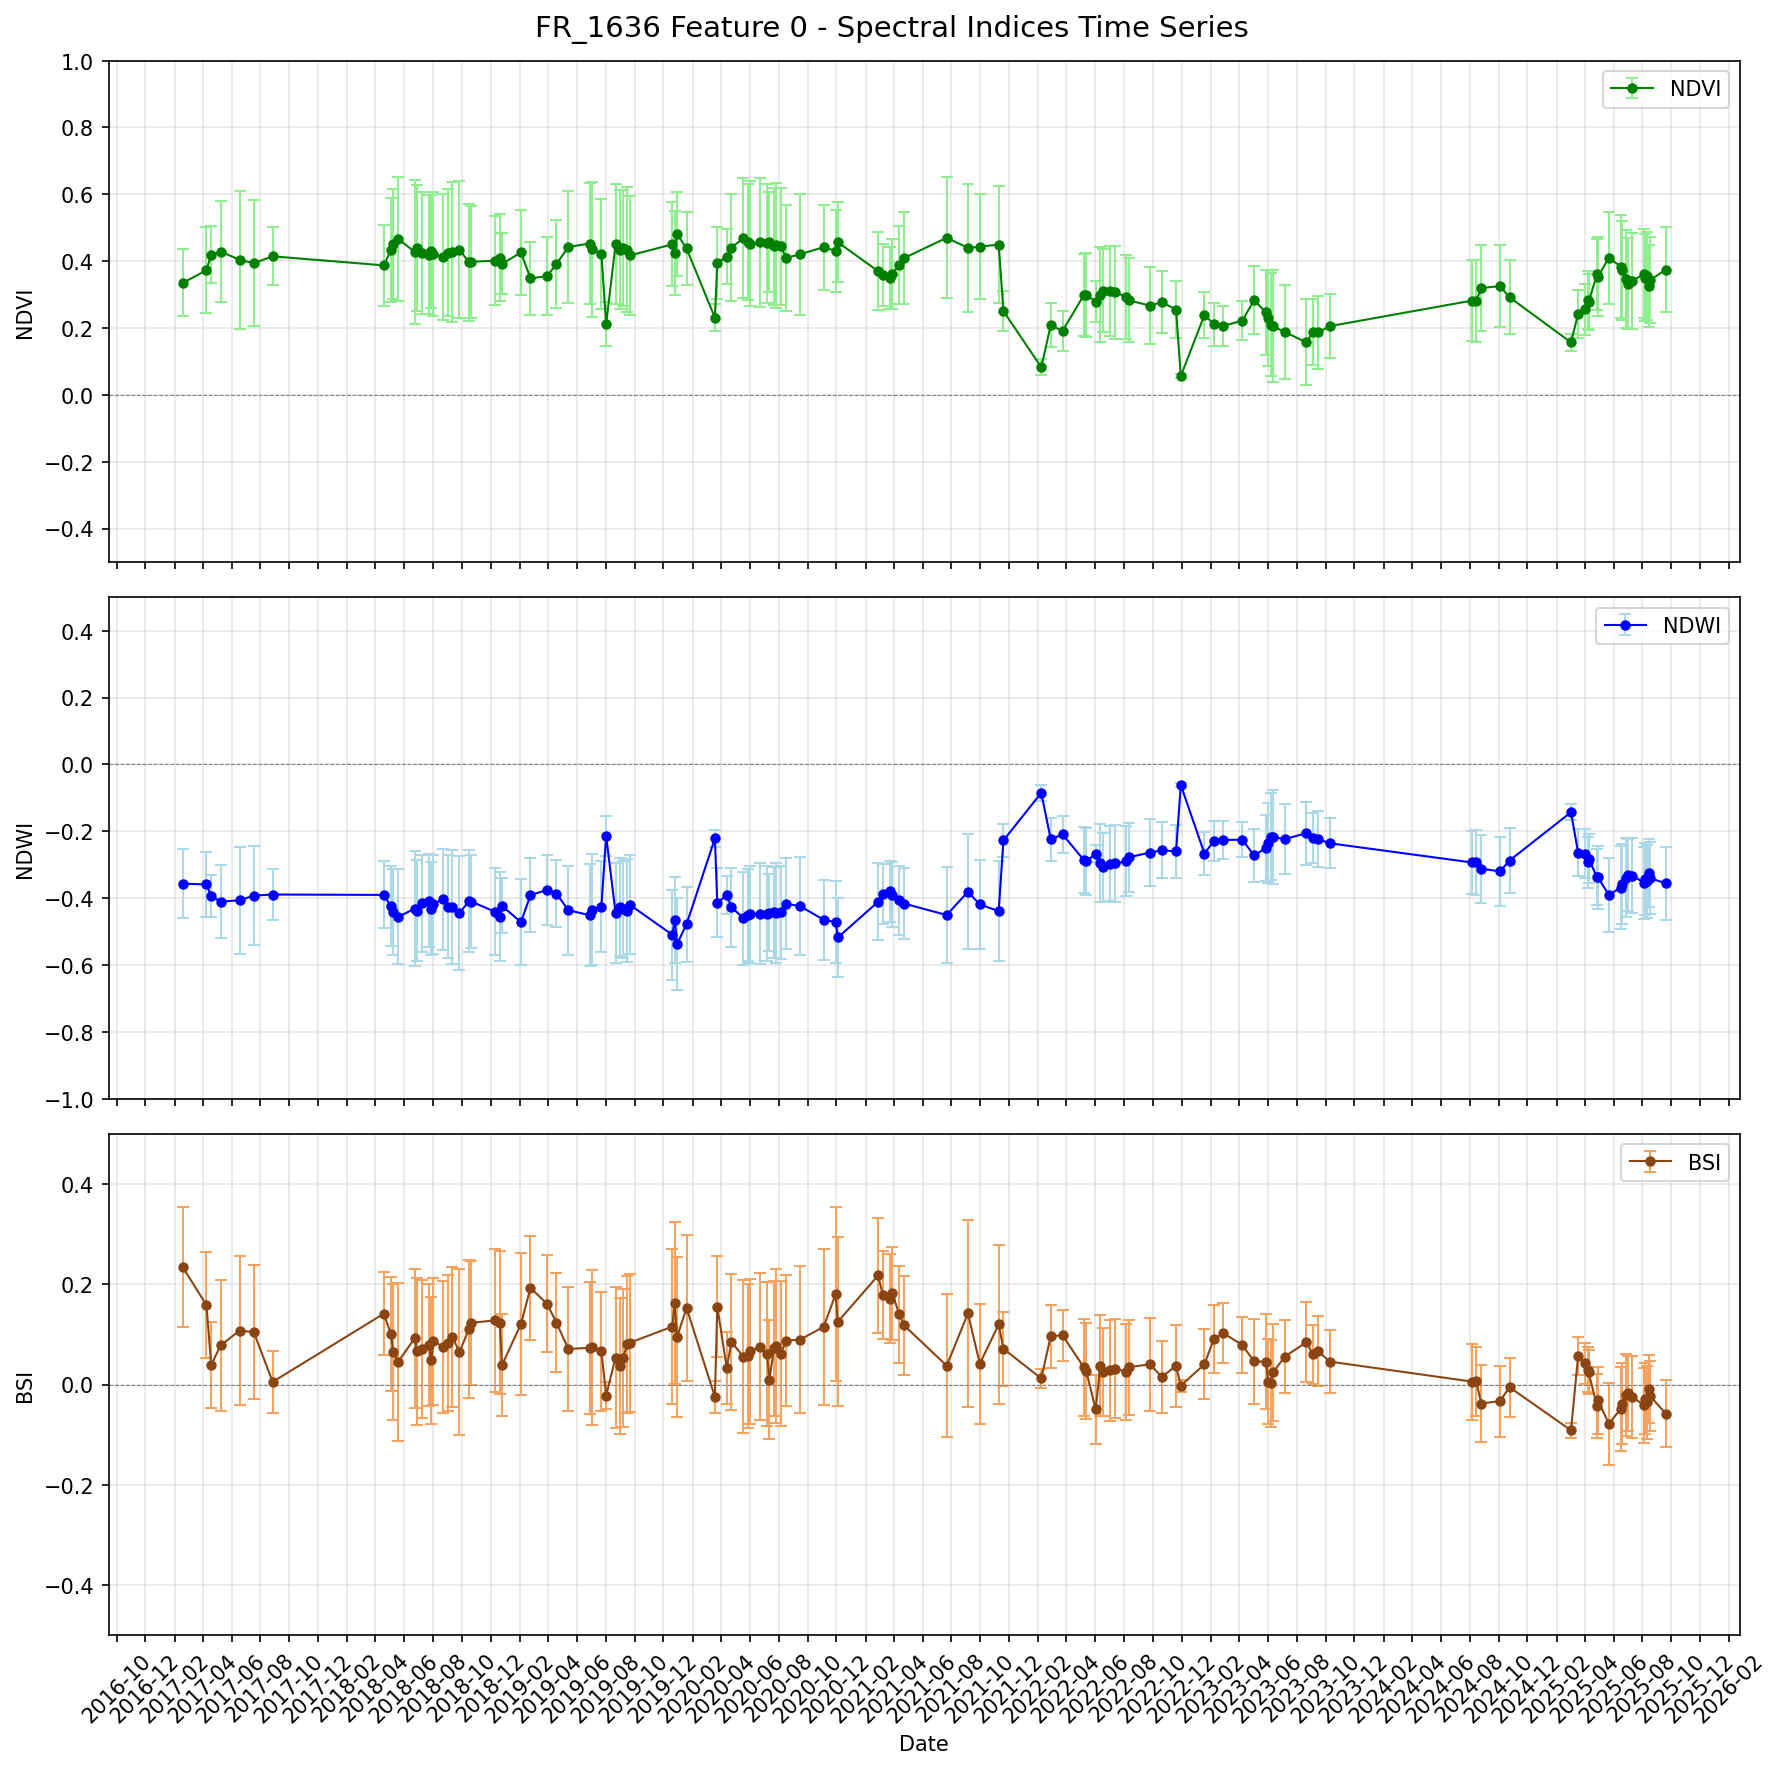
The spectral data are consistent with this observation. NDVI falls 31.9%, in line with the change in vegetation and surface structure during the clearance. BSI — the bare-soil index — falls 92.3%, pointing to a marked change in the exposed industrial surface. In the analysed indices, no pattern is detectable that would indicate completed new construction on the site.
The terrain analysis adds site context. The site sits in a river basin around 48 m altitude, mostly in gentle ground with a median slope of 3.7°. A HAND screening of the drainage-connected part — about 13% of the grid — places 19.4% of that area in the high flood band under 2 m above drainage, 24.3% in the moderate band and 56.3% in the low band.
This is topographic screening, not a hydraulic flood model. It contains no rainfall, discharge or scenario modelling.
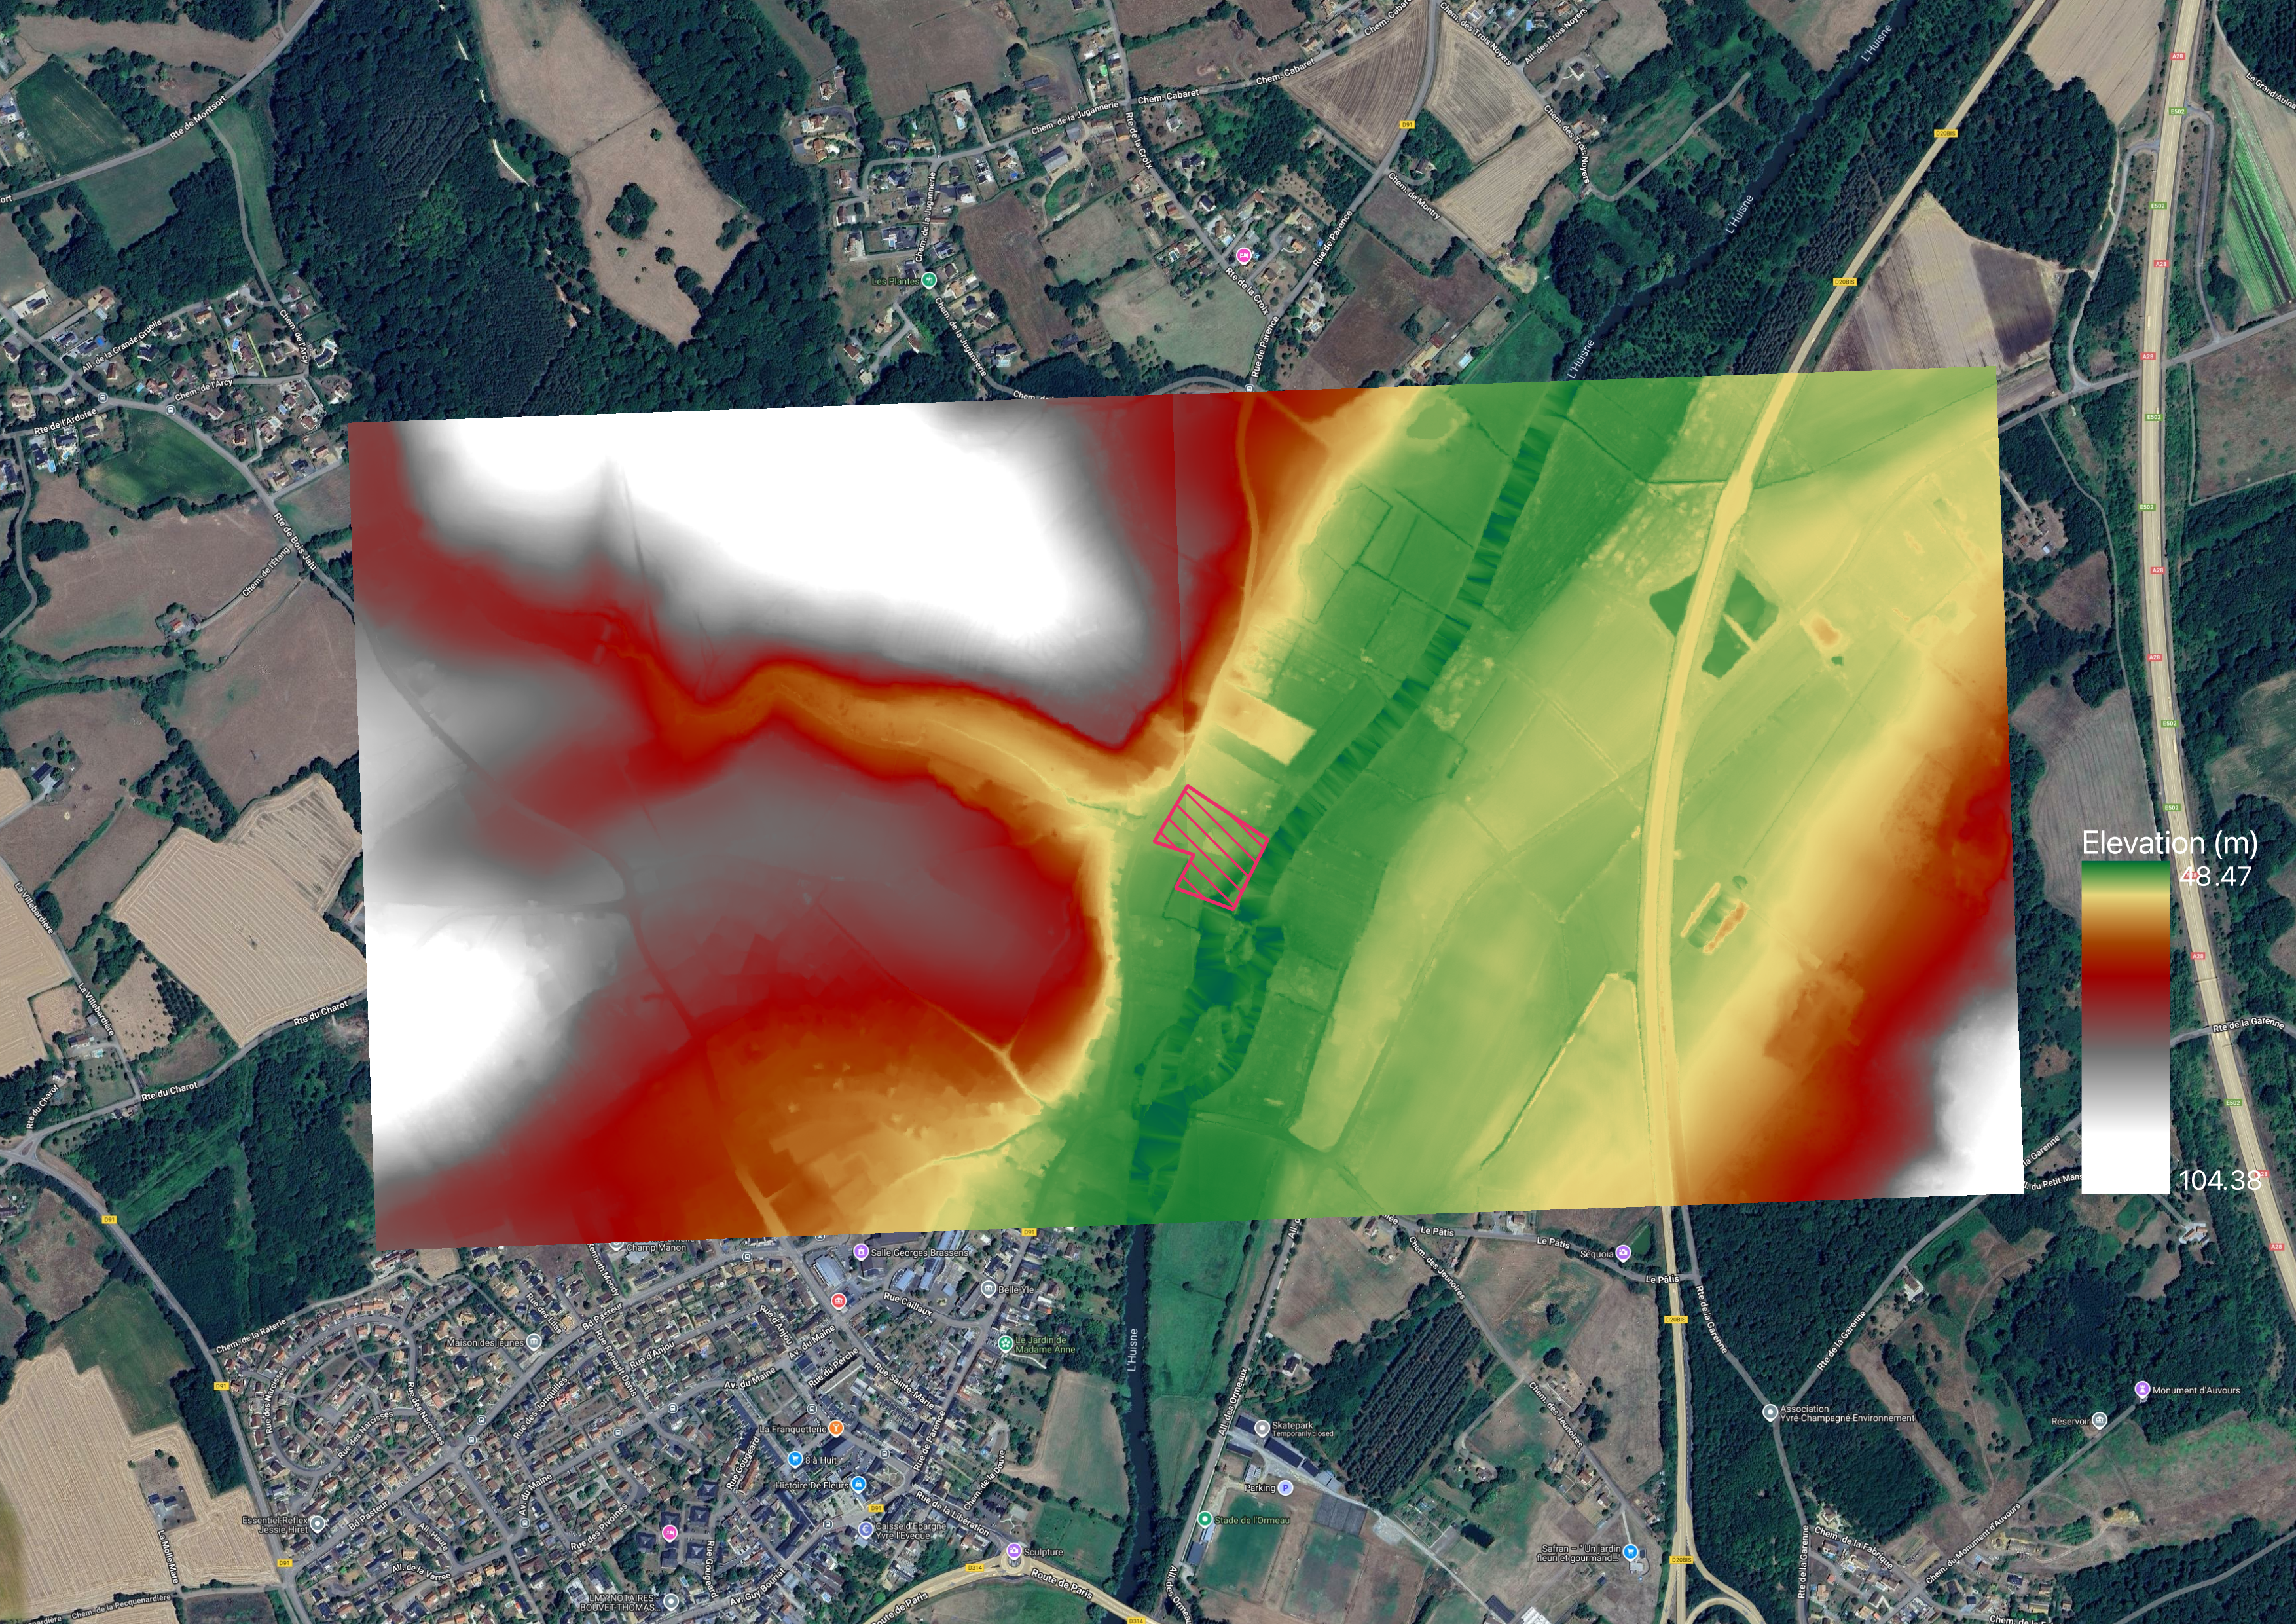
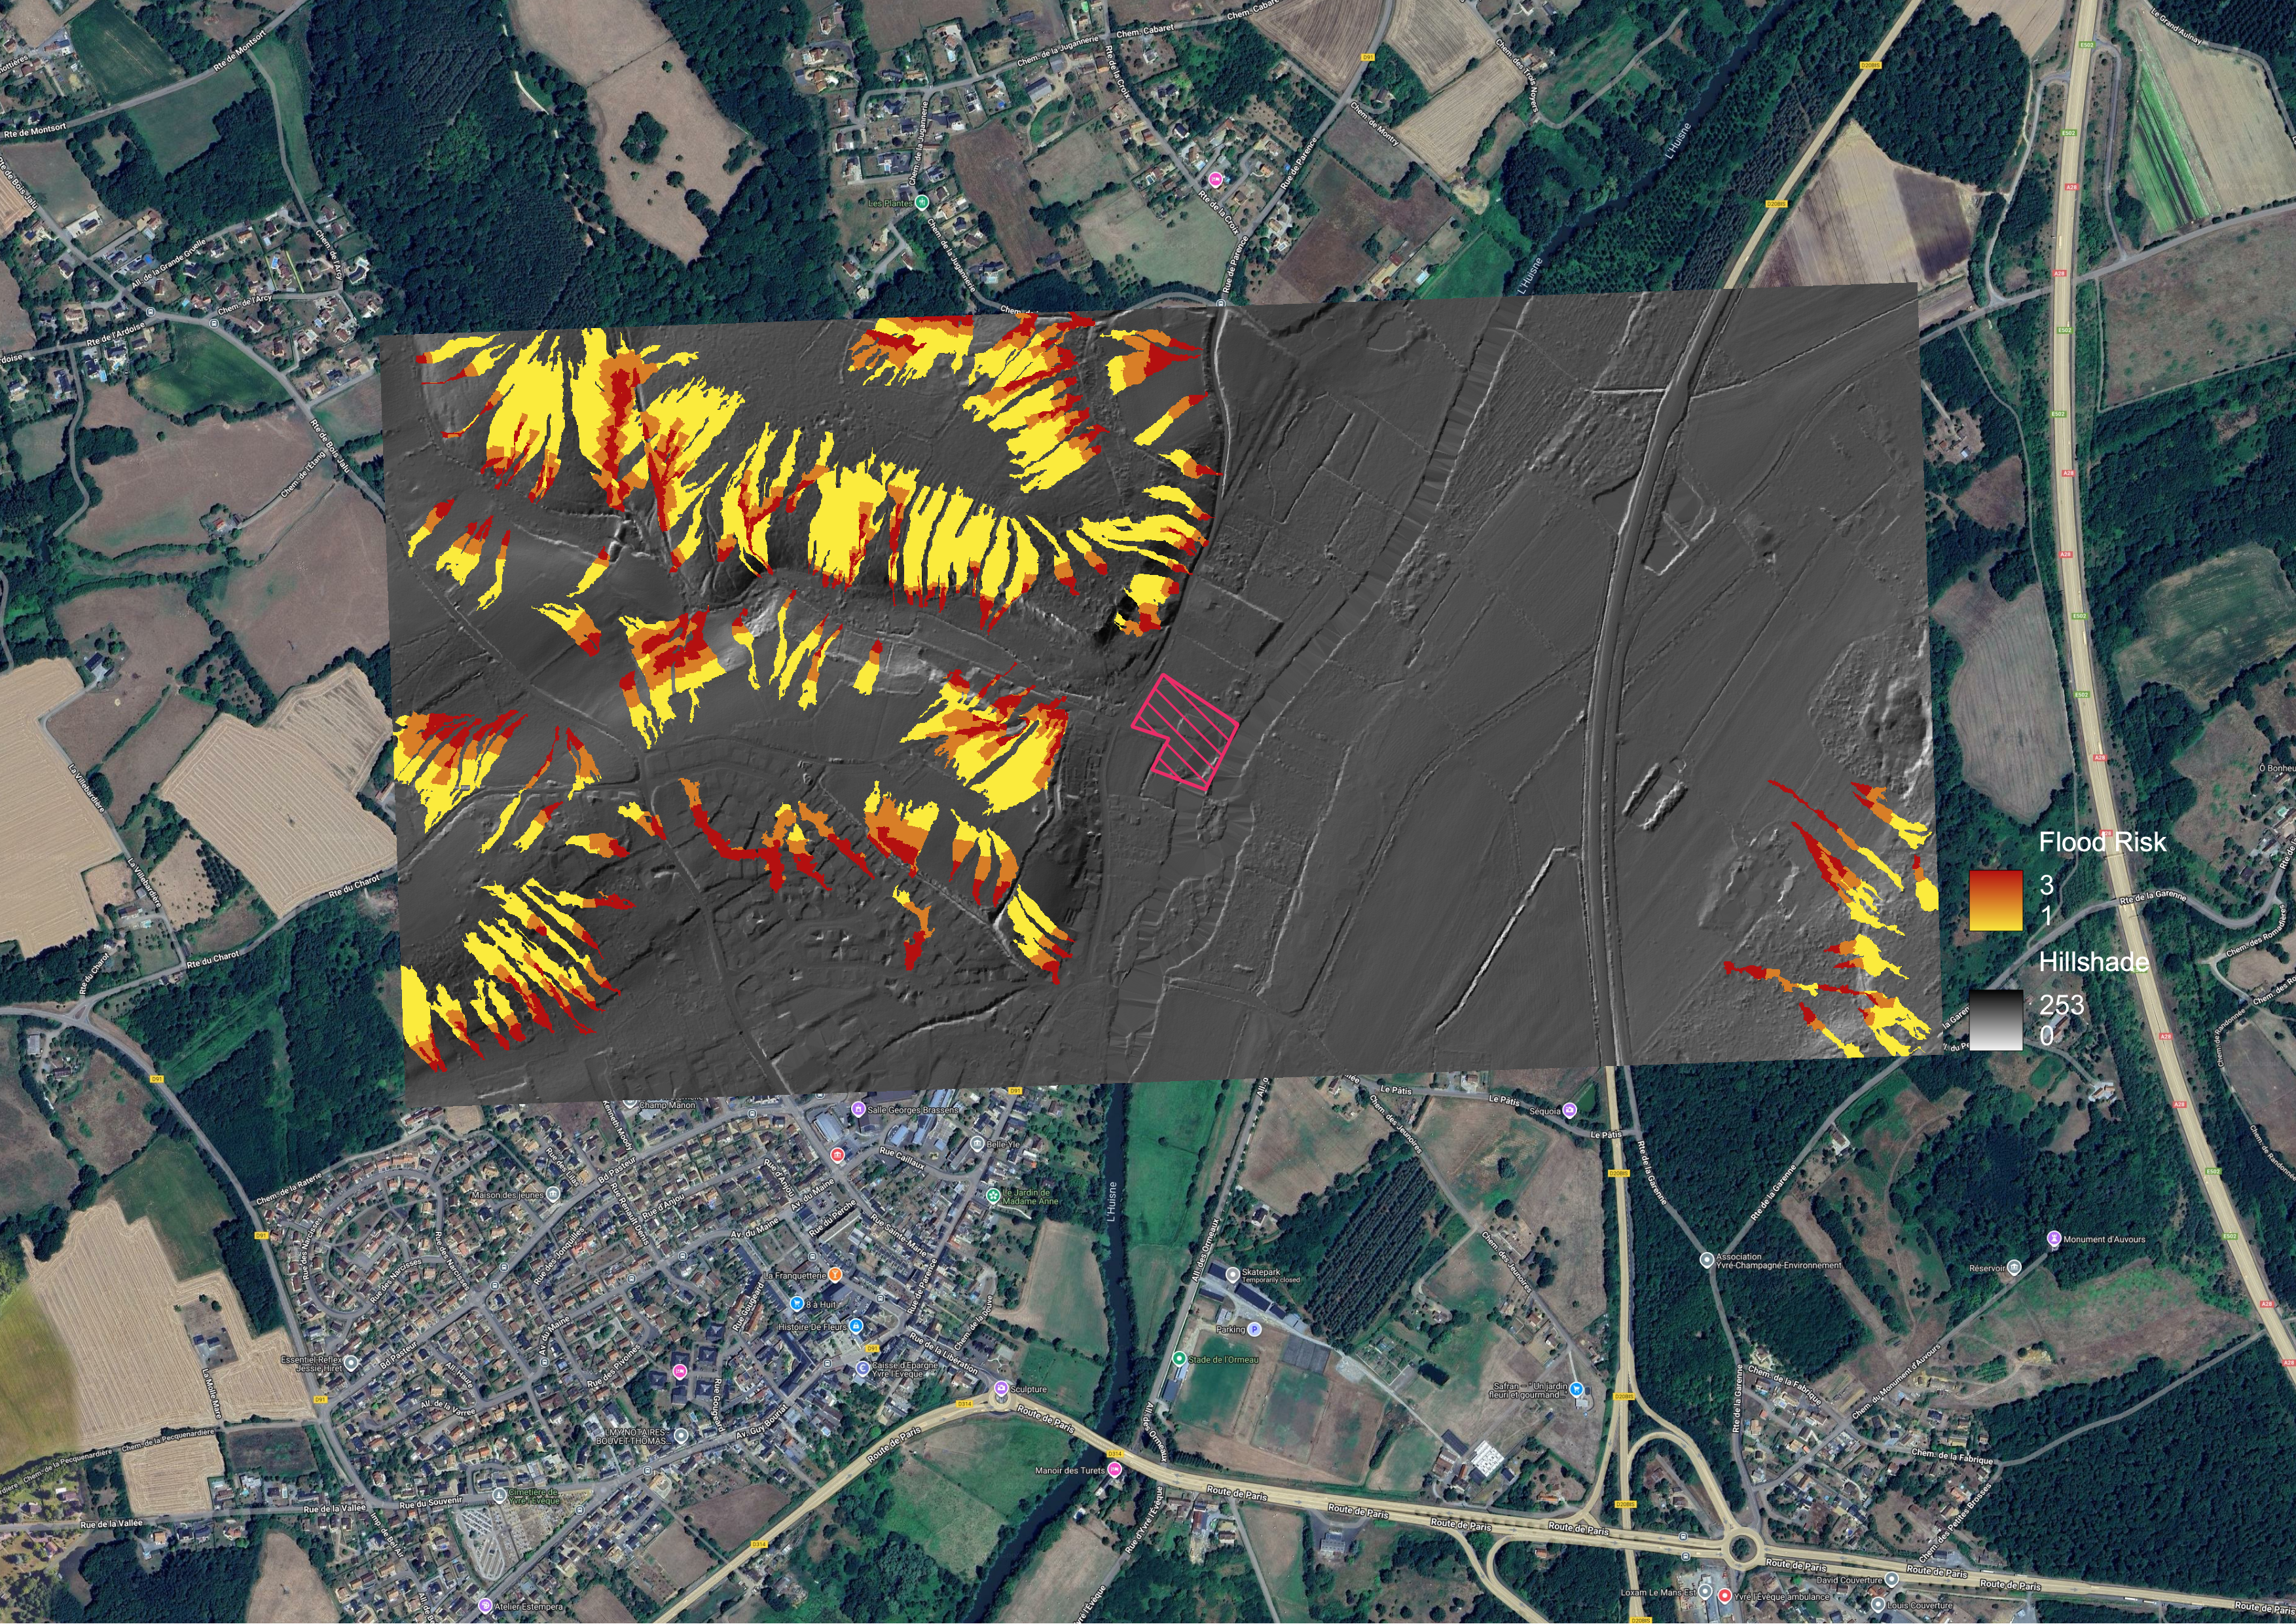
The preparatory measure is clearly visible in the satellite data: the former factory building was removed and the site cleared. The reported structural completion of the 25 social-housing units, however, cannot be traced in the analysed imagery through to mid-2025. In addition, the topographic screening indicates potential flood exposure of parts of the site on the Huisne.
Location: 42°52′55.6″N 8°01′08.2″W
Spain — Portodís, Santiso (Galicia)
Hydropower extension on the Furelos · €642,301 · +1.6 MW turbine capacity · 42°52′56″N 8°01′08″W
The programme funded an extension of the small Portodís hydropower station, adding 1.6 MW of turbine capacity.
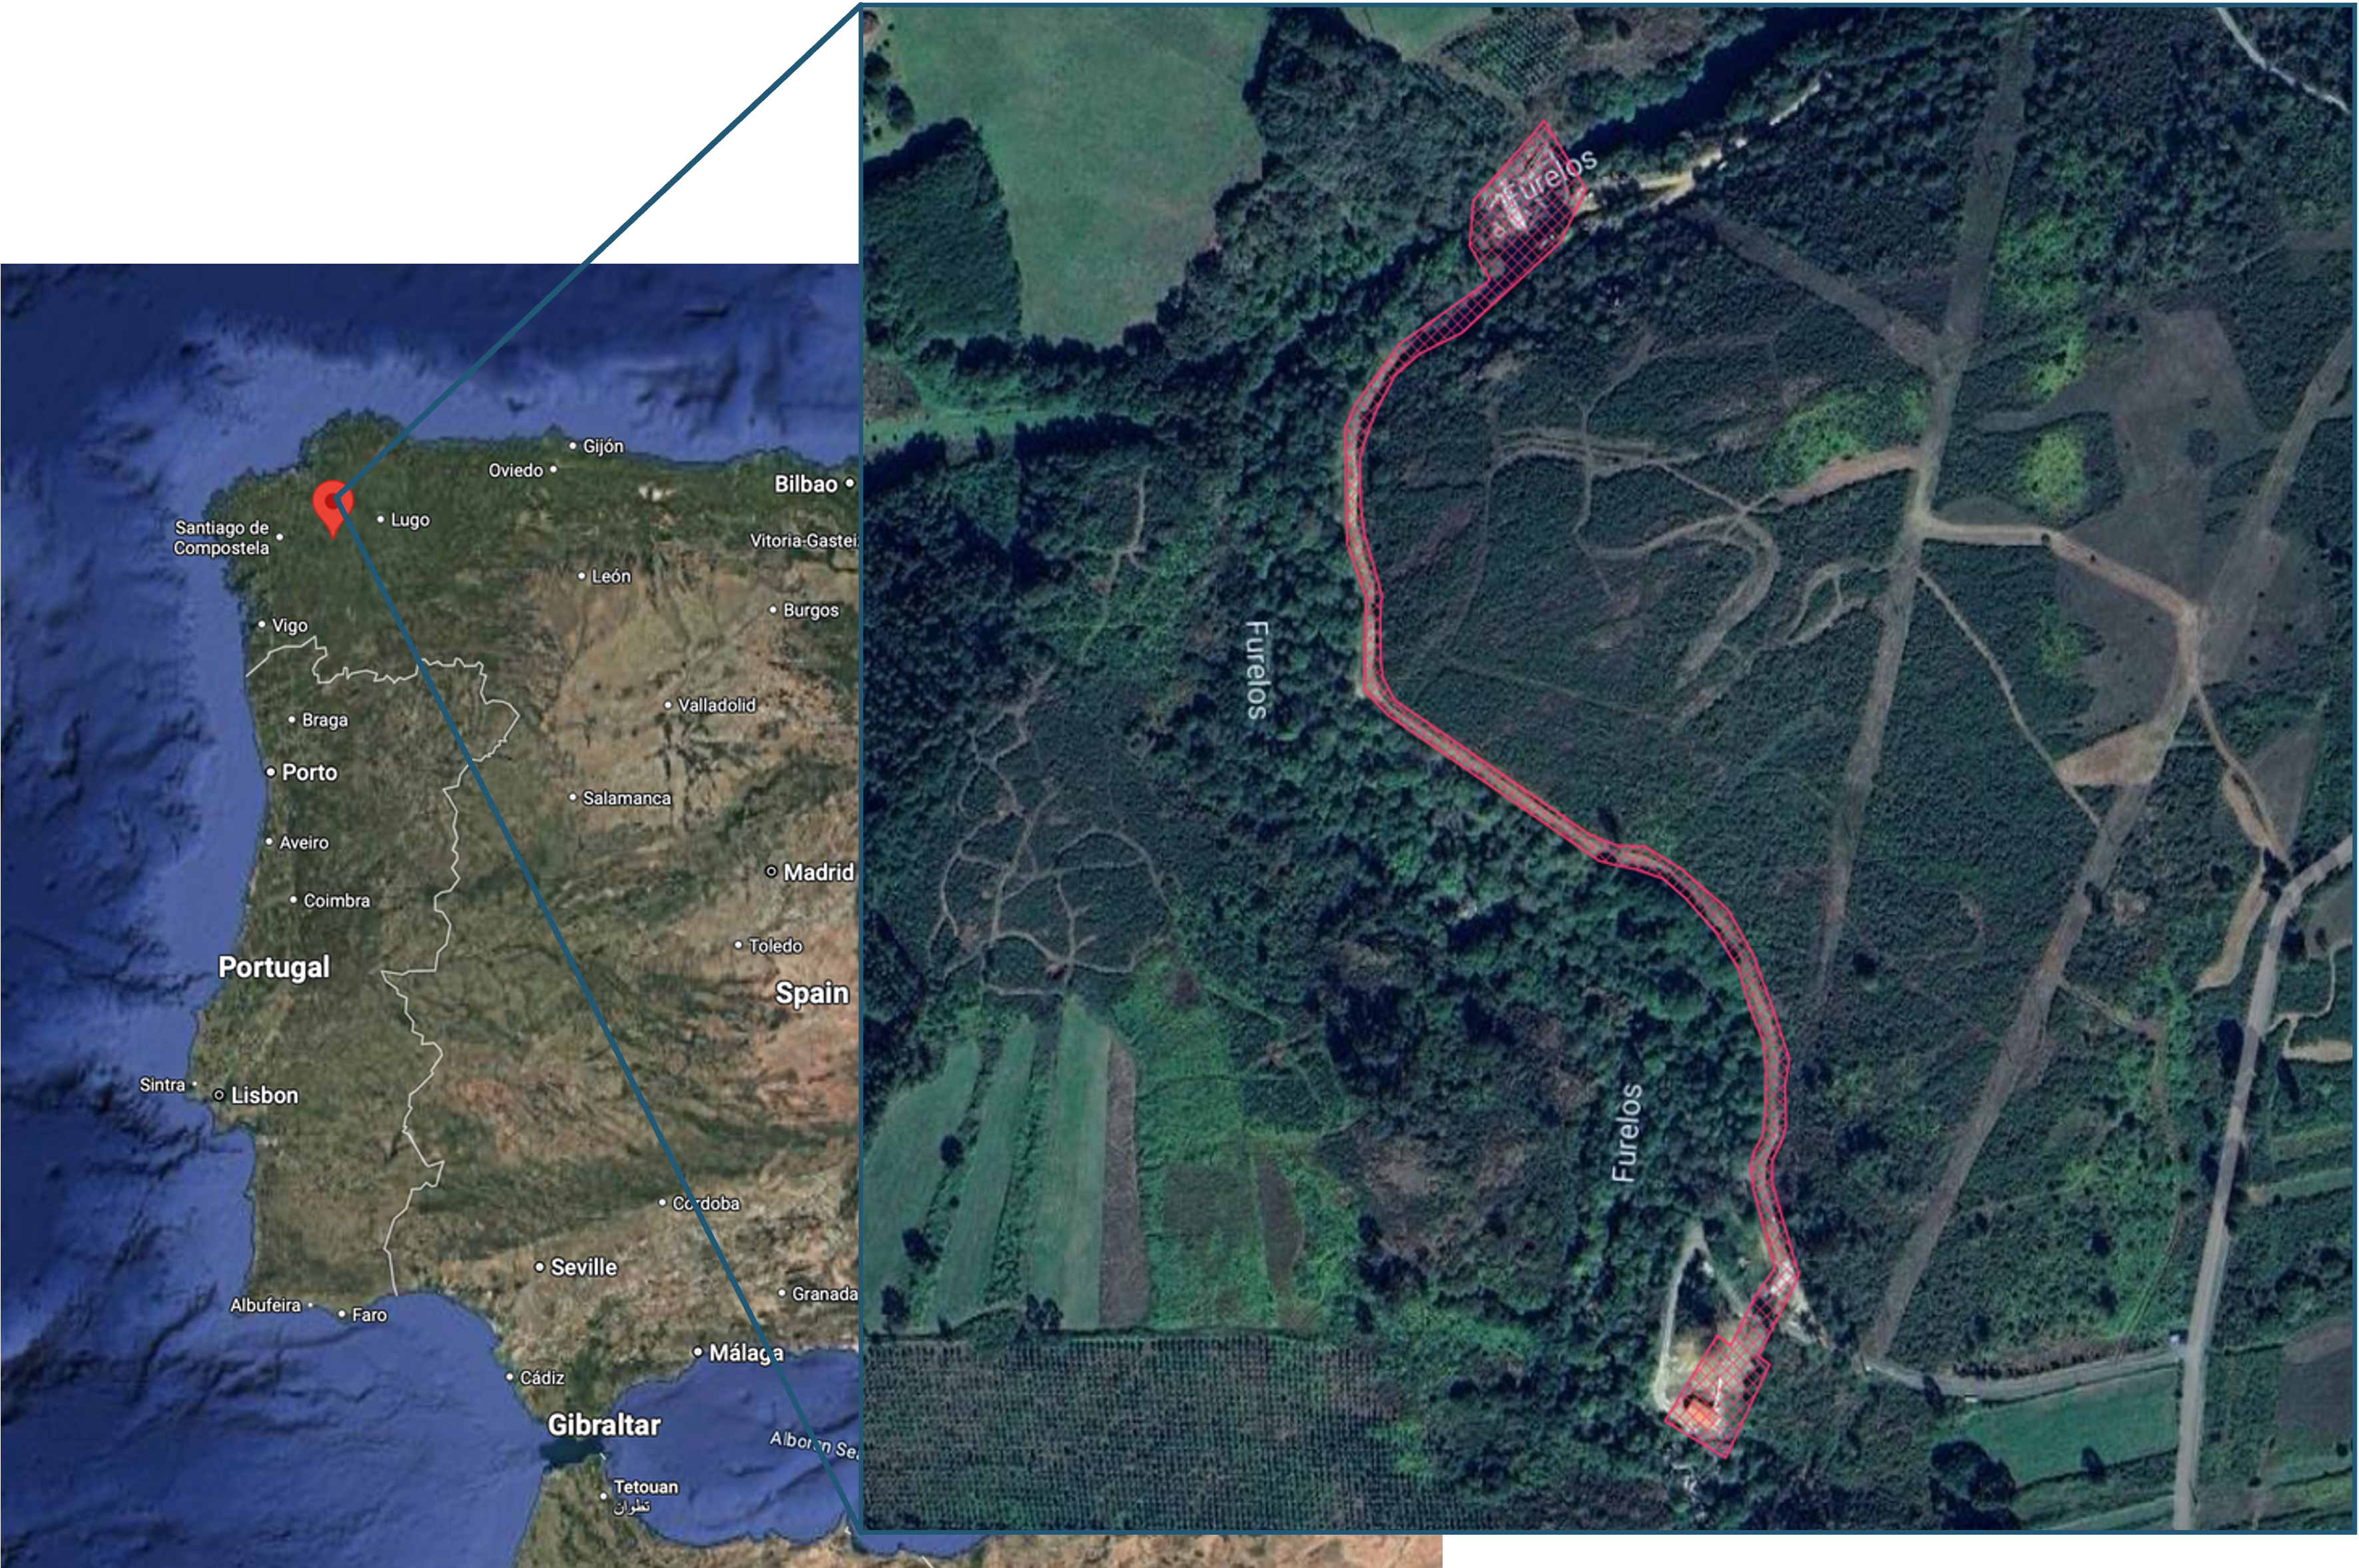
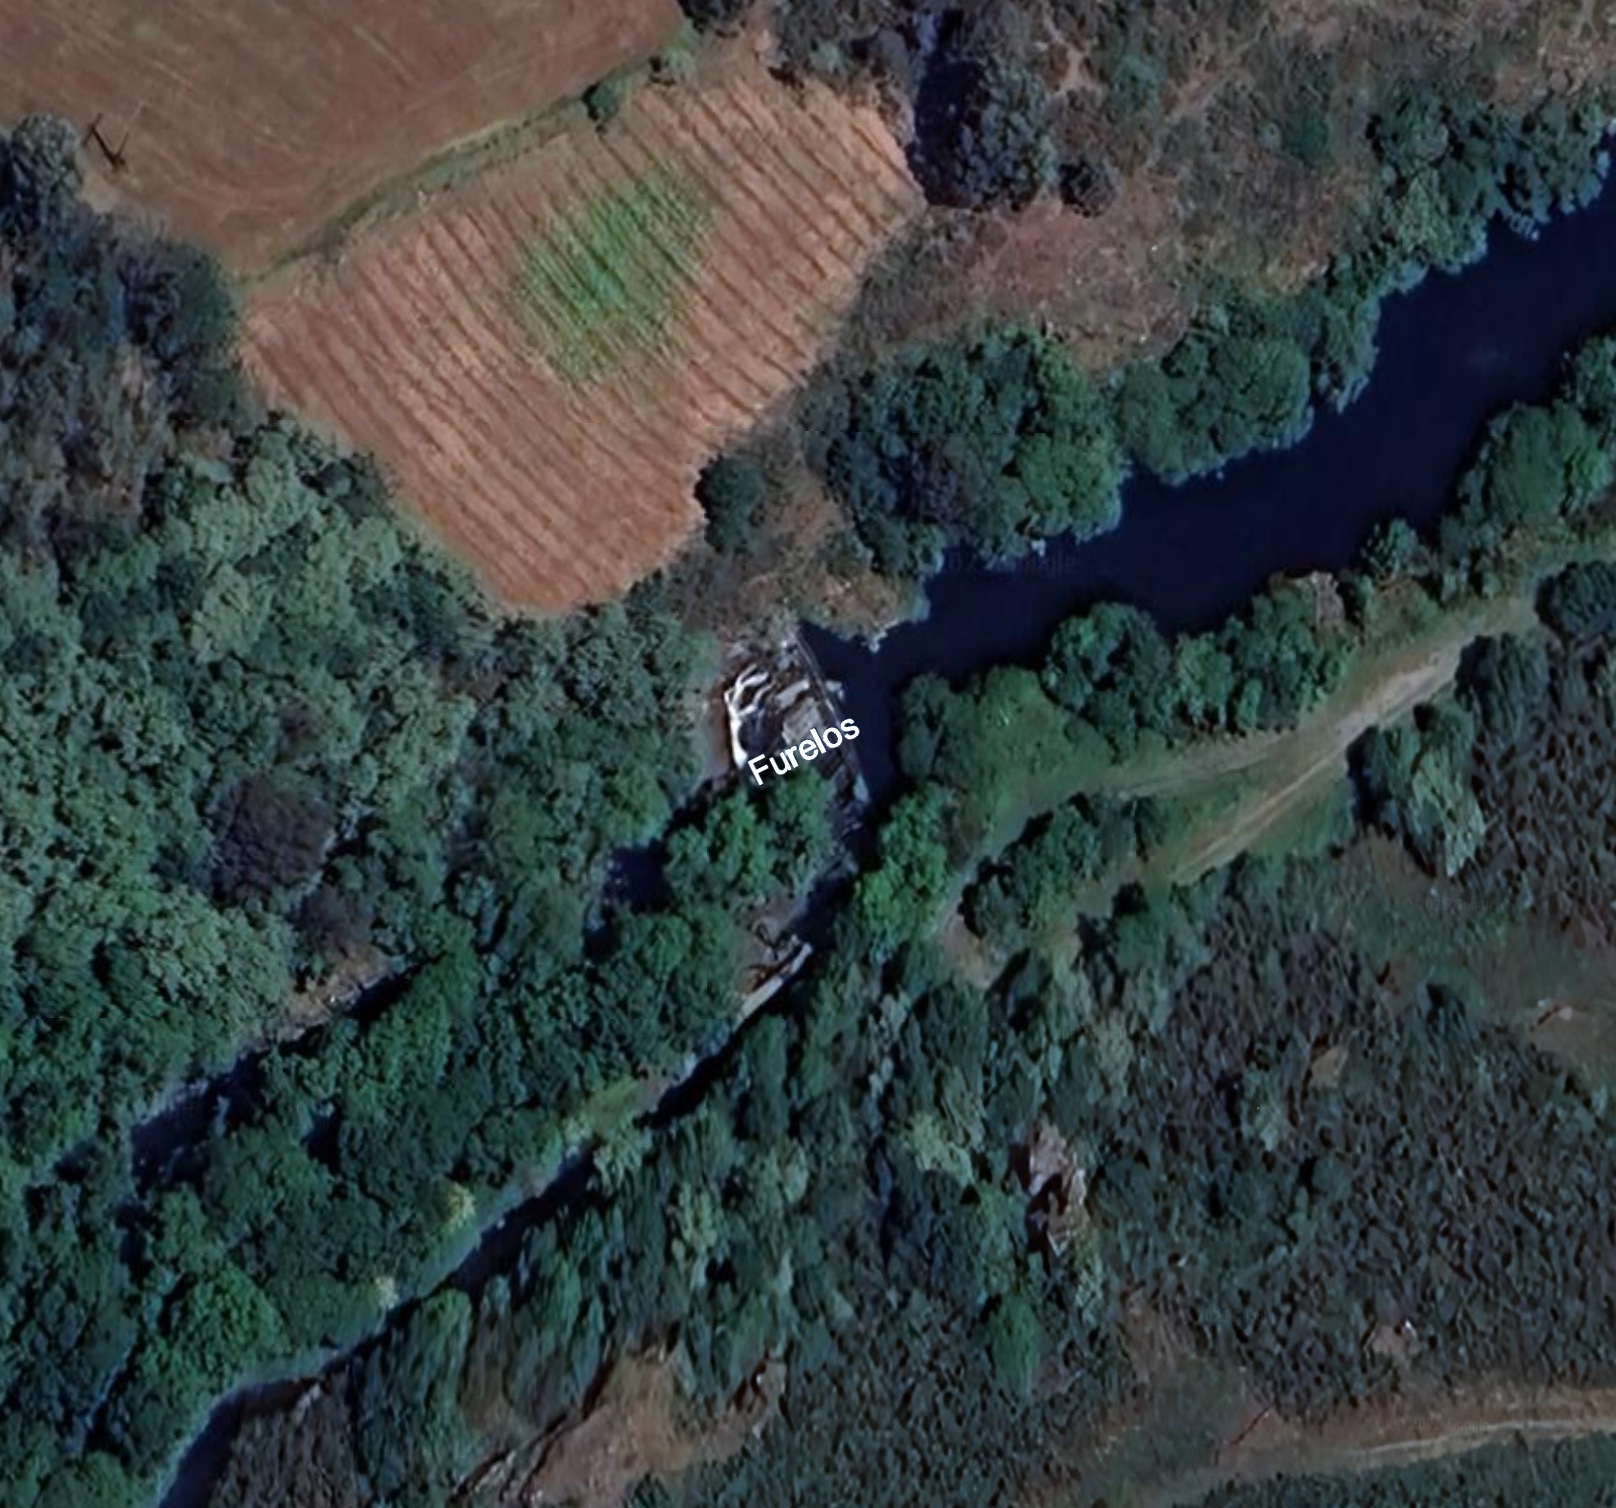
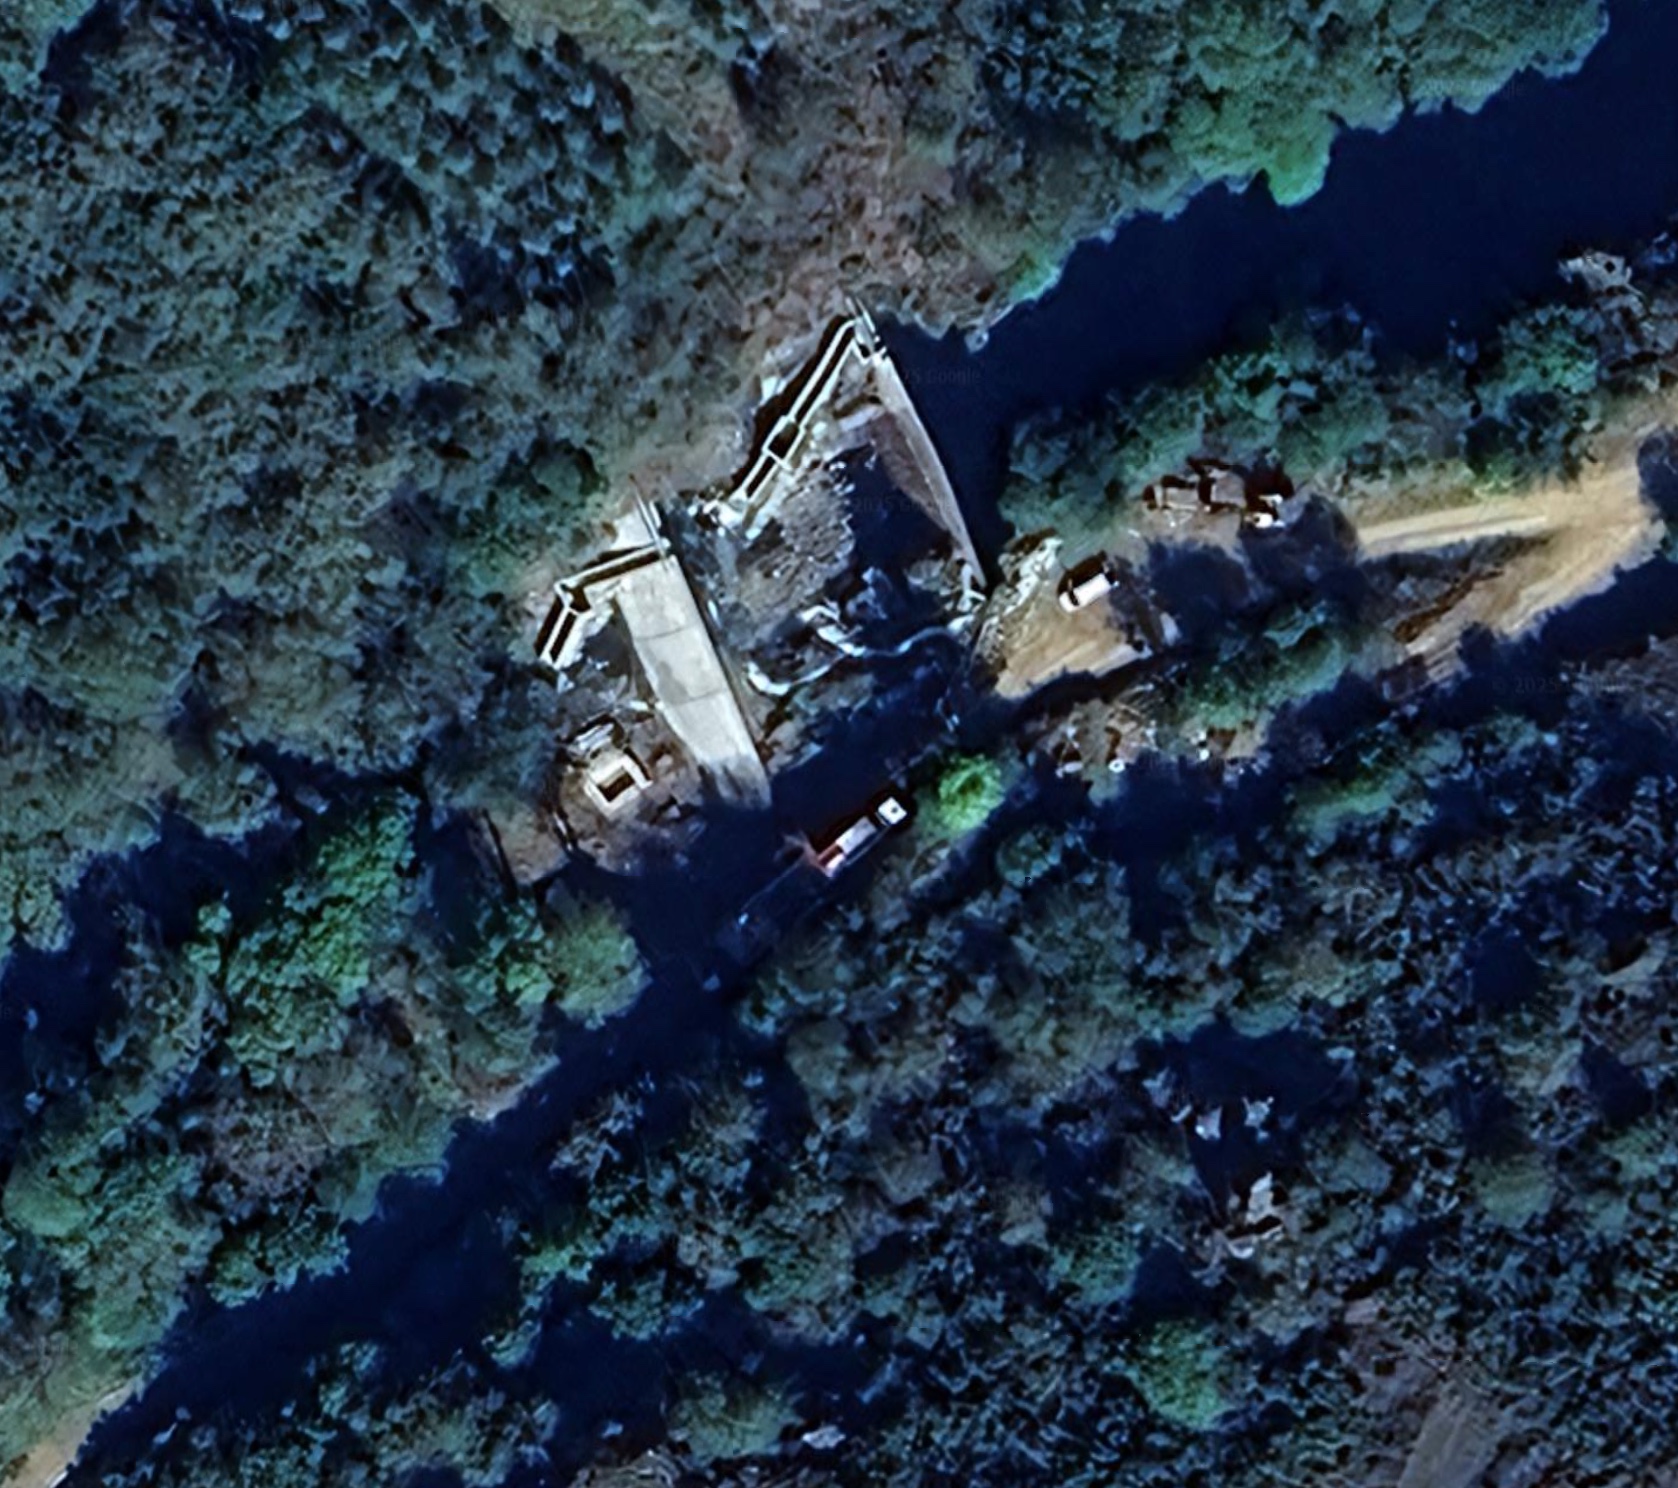
Two structures were checked separately: the turbine hall and the dam wall. In imagery from May 2023 and September 2025, both have been renewed. The turbine hall has a new roof; the dam wall was structurally altered.
| 2023-05-26 — dam wall | 2025-09-17 — dam wall |
|---|---|
 |  |
| 2023-05-26 — turbine hall | 2025-09-17 — turbine hall |
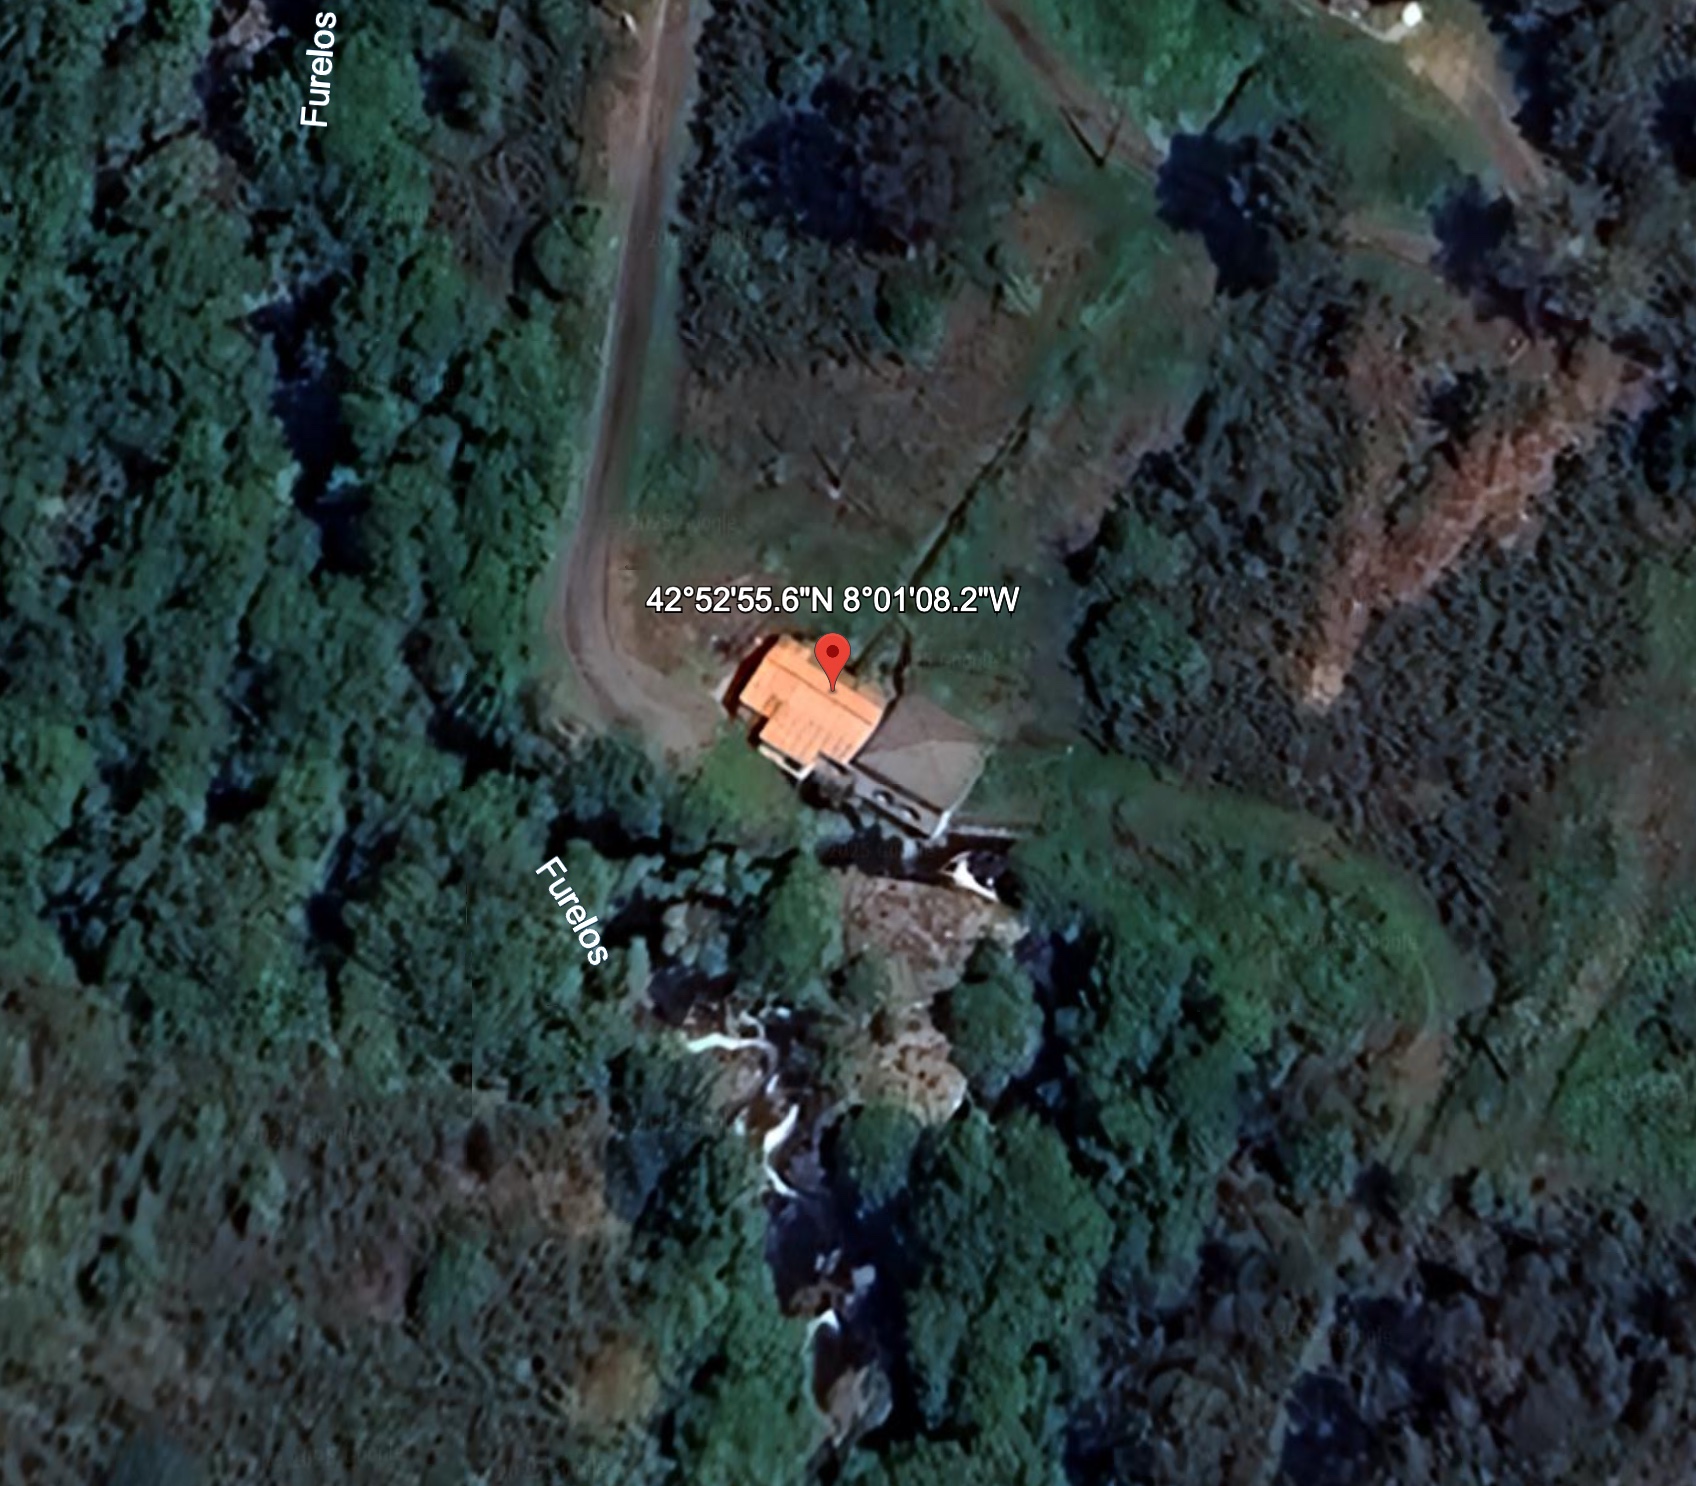 | 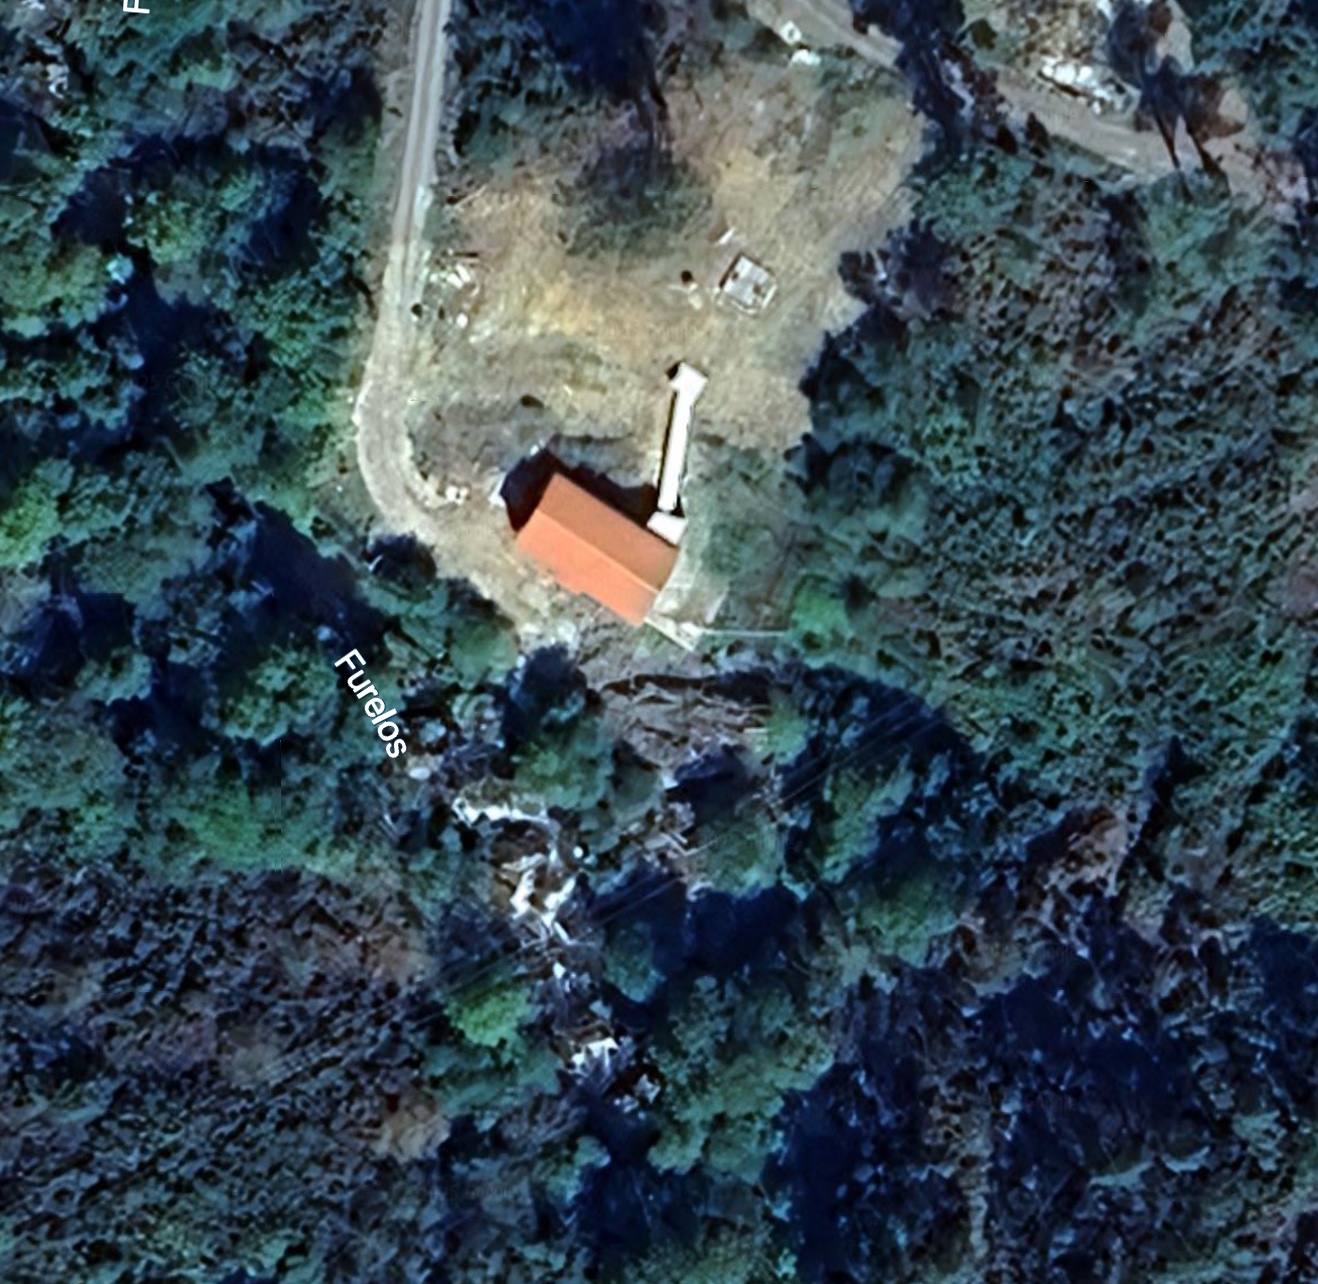 |
Portodís — dam wall and turbine hall, May 2023 and September 2025.
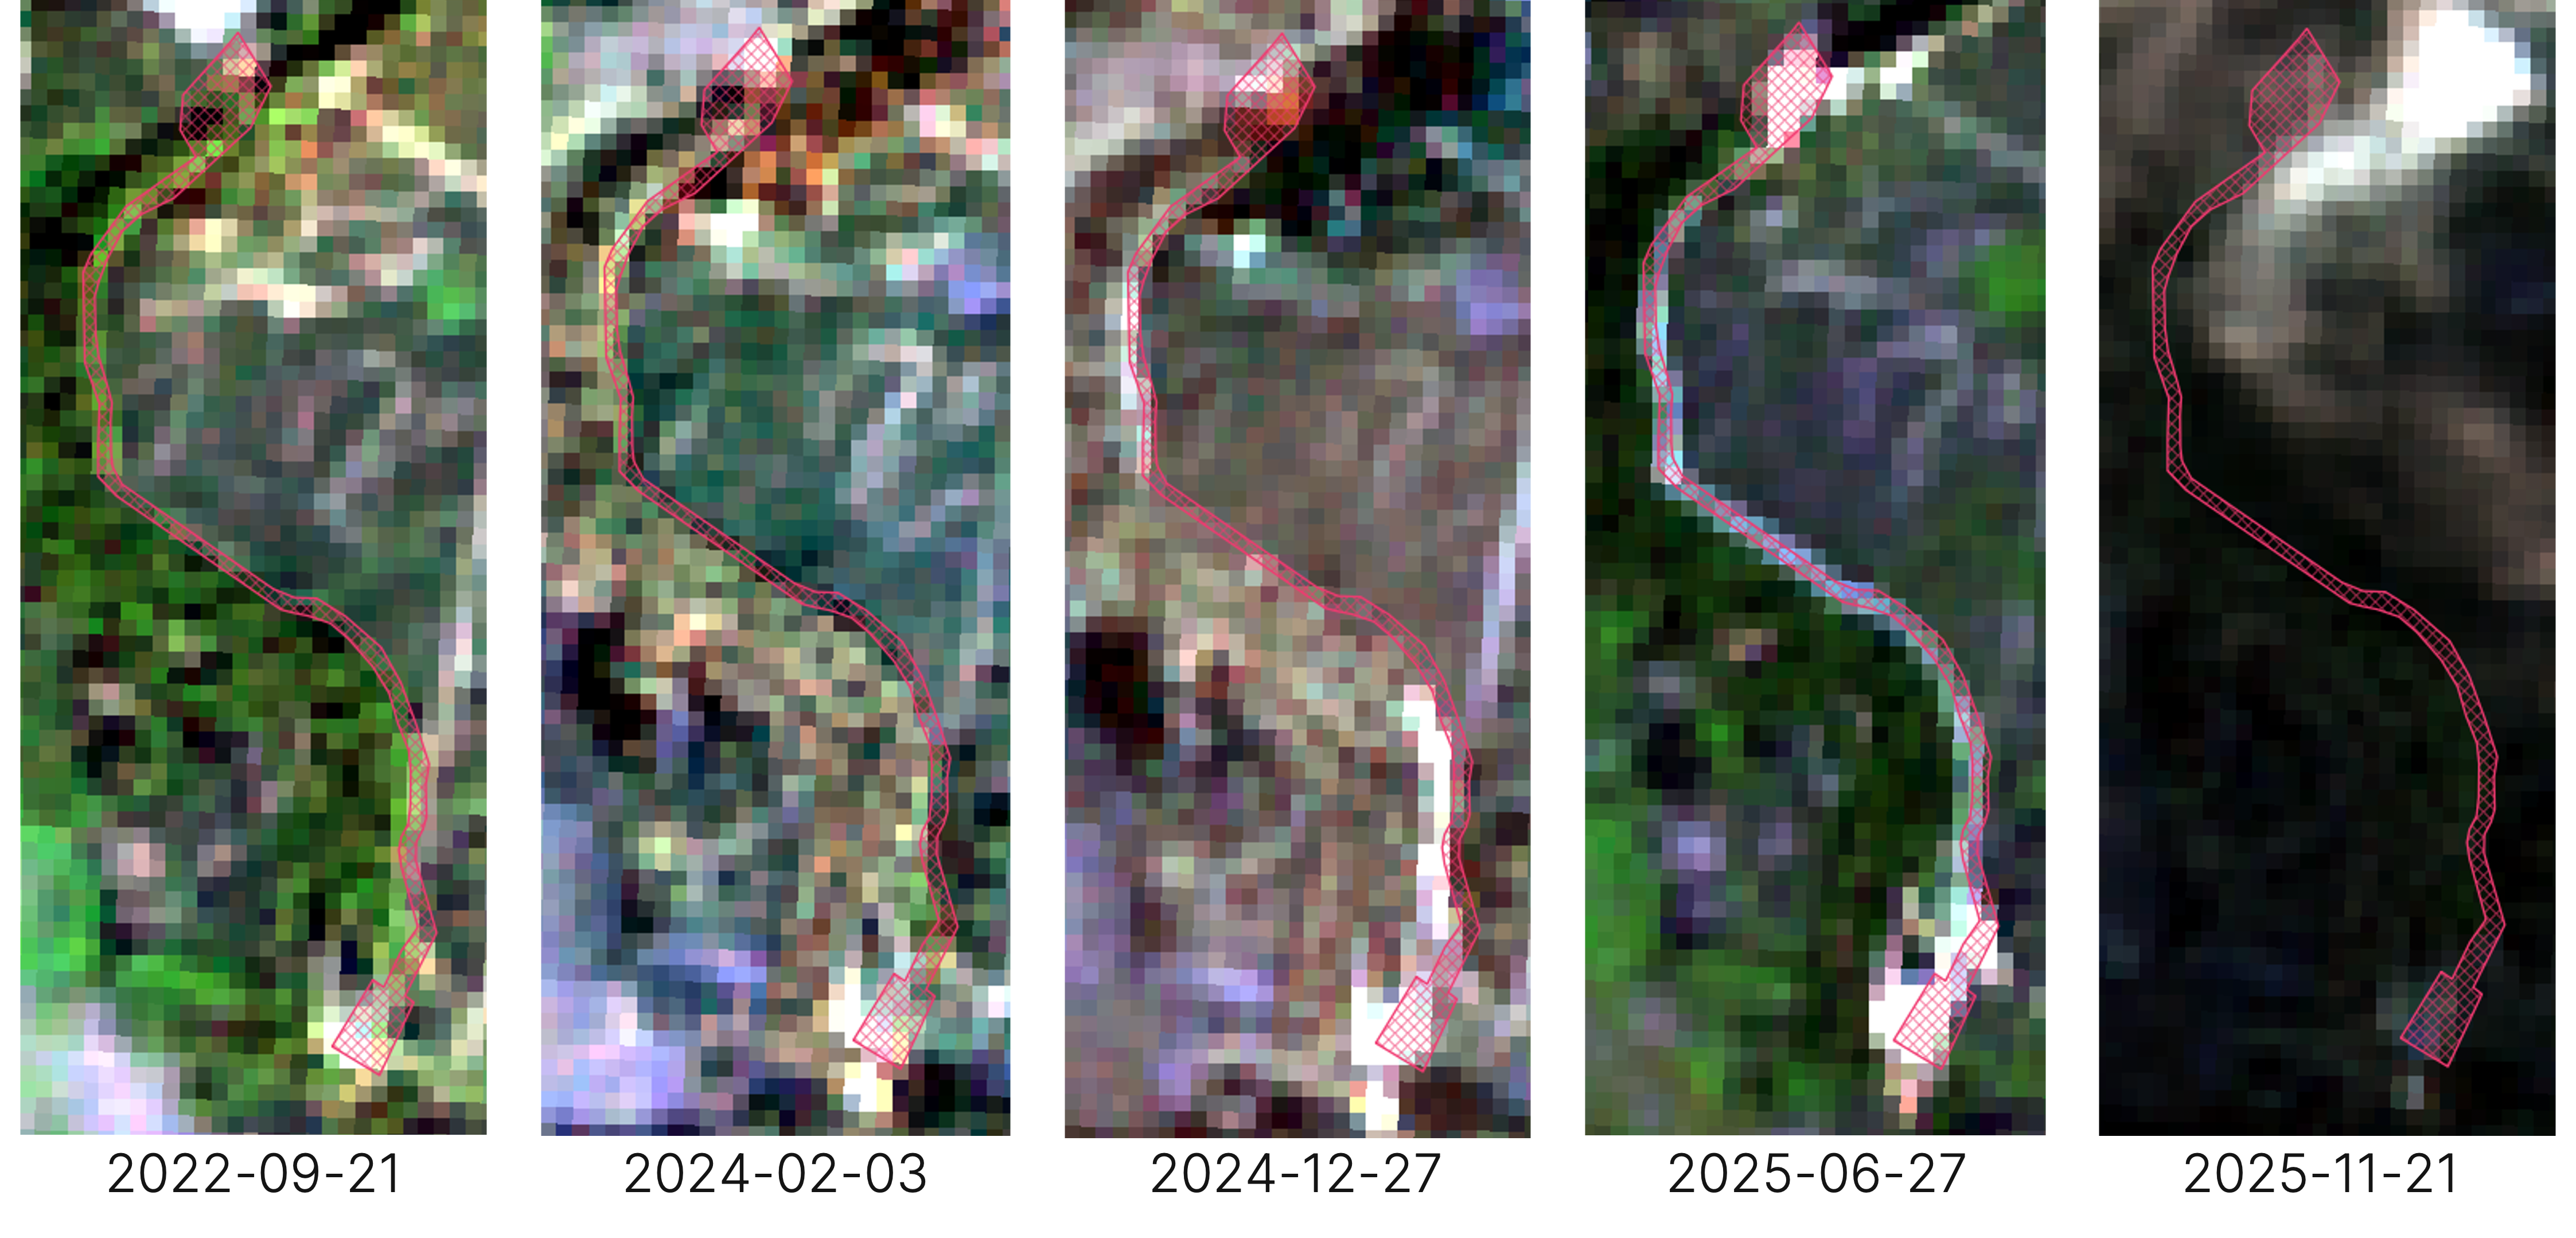
The spectral series over 2017–2025 is consistent with construction and a subsequent stabilisation of the surface. NDVI drops 51.1%, the steepest of the three sites, in line with interventions in vegetation, groundworks and new access roads. NDWI rises 49.4%, pointing to a stronger presence of open water in the image. BSI volatility falls once the works end, which indicates a more stable surface situation after the construction phase.
The reported measure is visibly traceable at the site. The structural changes to the dam wall and turbine hall are detectable in the analysed imagery. This confirmation in particular is relevant for green-bond reporting: it reduces uncertainty, provides external evidence and makes a project statement independently verifiable.
Location: 45°25′13.0″N 13°35′07.4″E
Croatia — Donji Picudo East, Umag (Istria)
Landfill rehabilitation · €3.34 M · 30,000 m², two phases (2016 and 2025) · 45°25′13″N 13°35′07″E
The project concerns the rehabilitation of a closed non-hazardous-waste landfill on the Istrian coast. The site was sealed under an engineered cap and is to be made usable again.
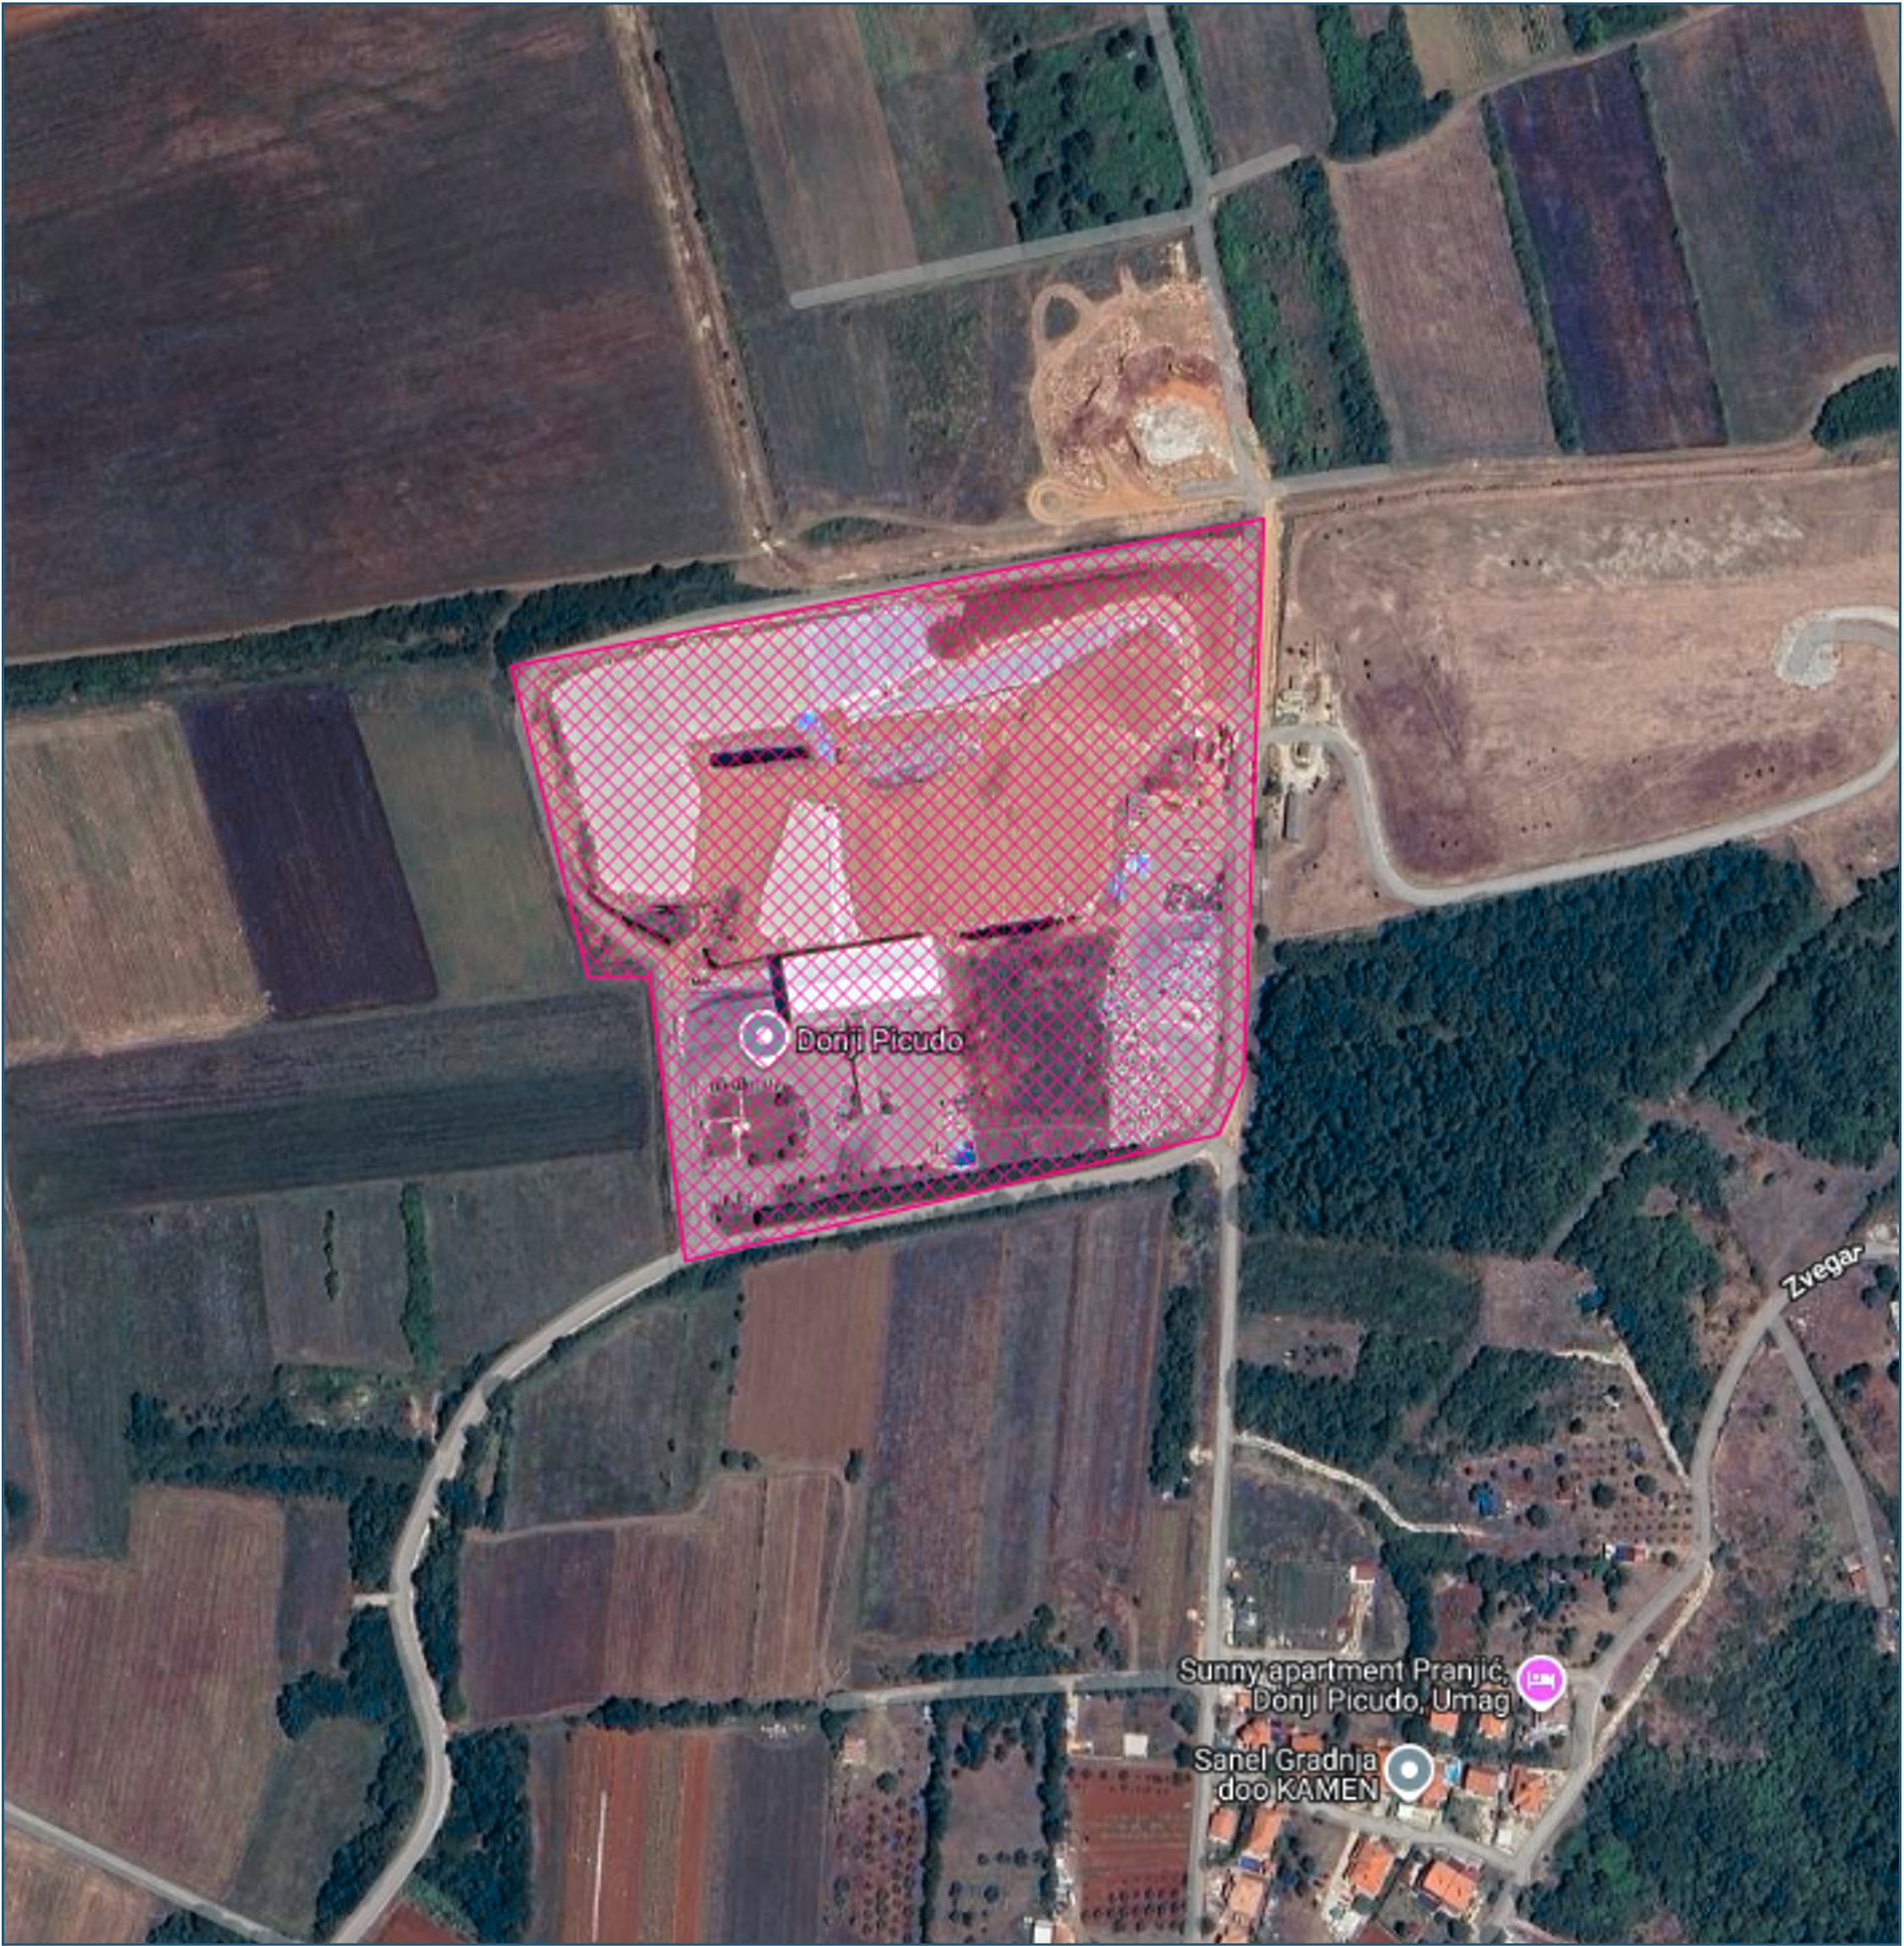
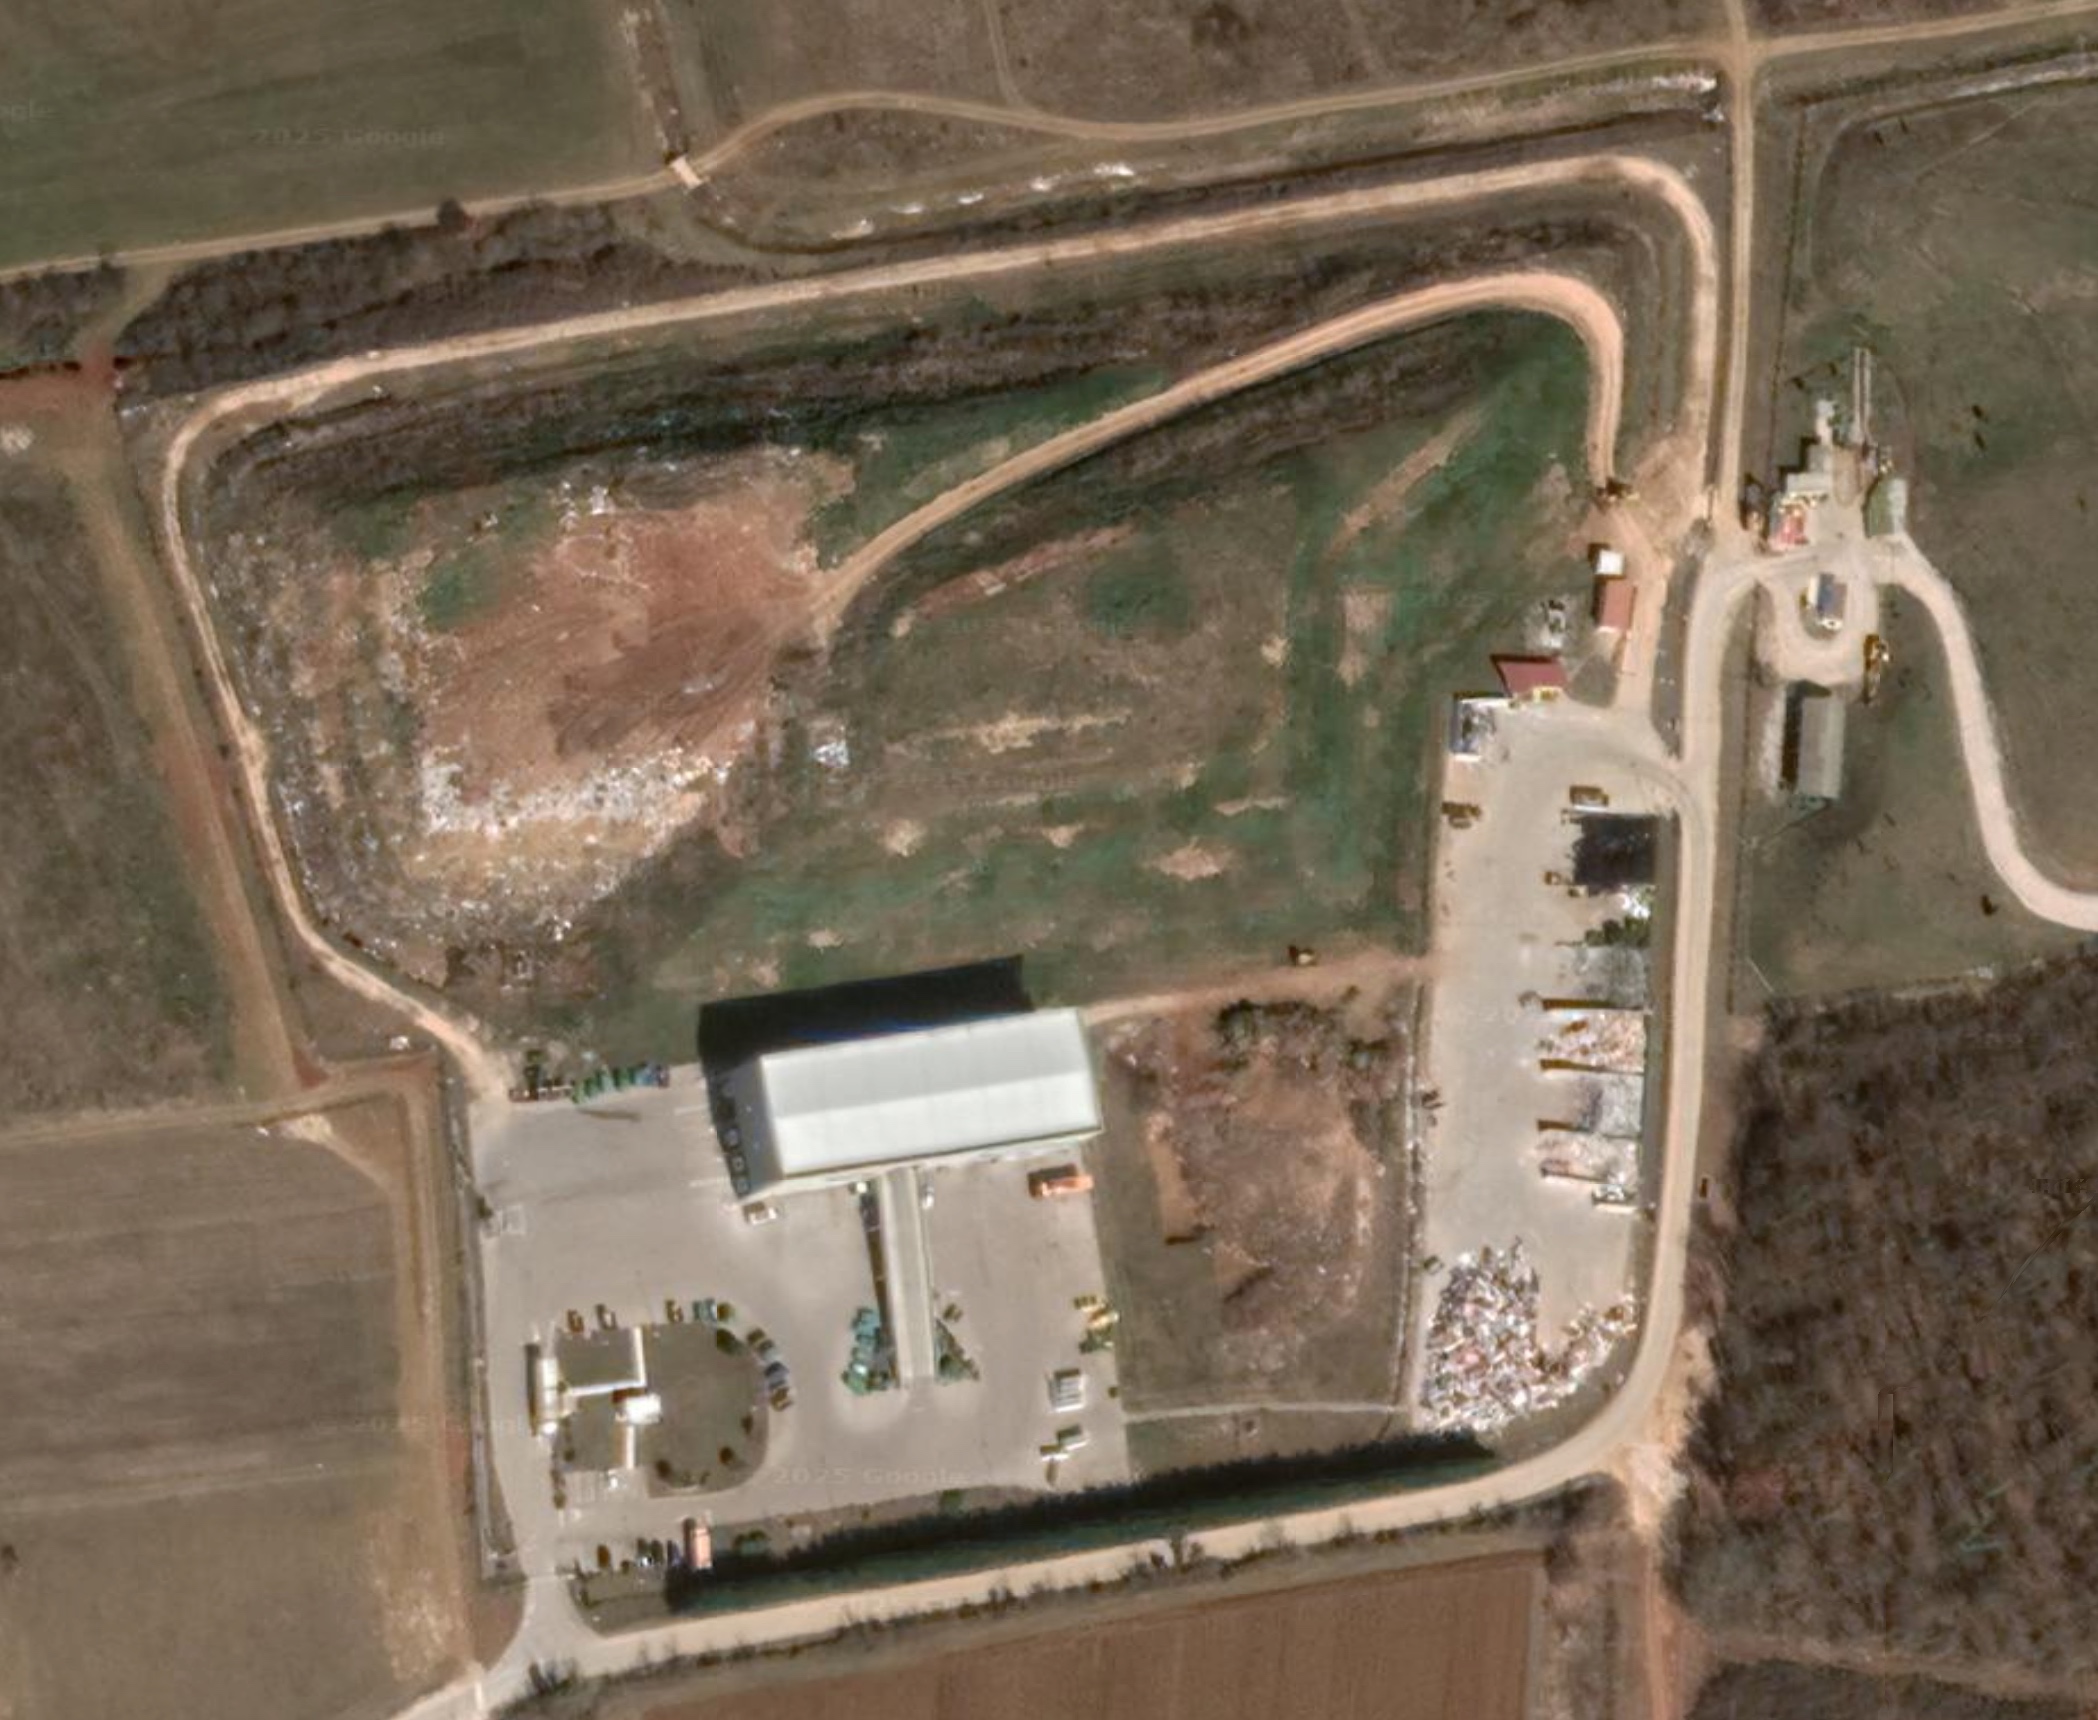
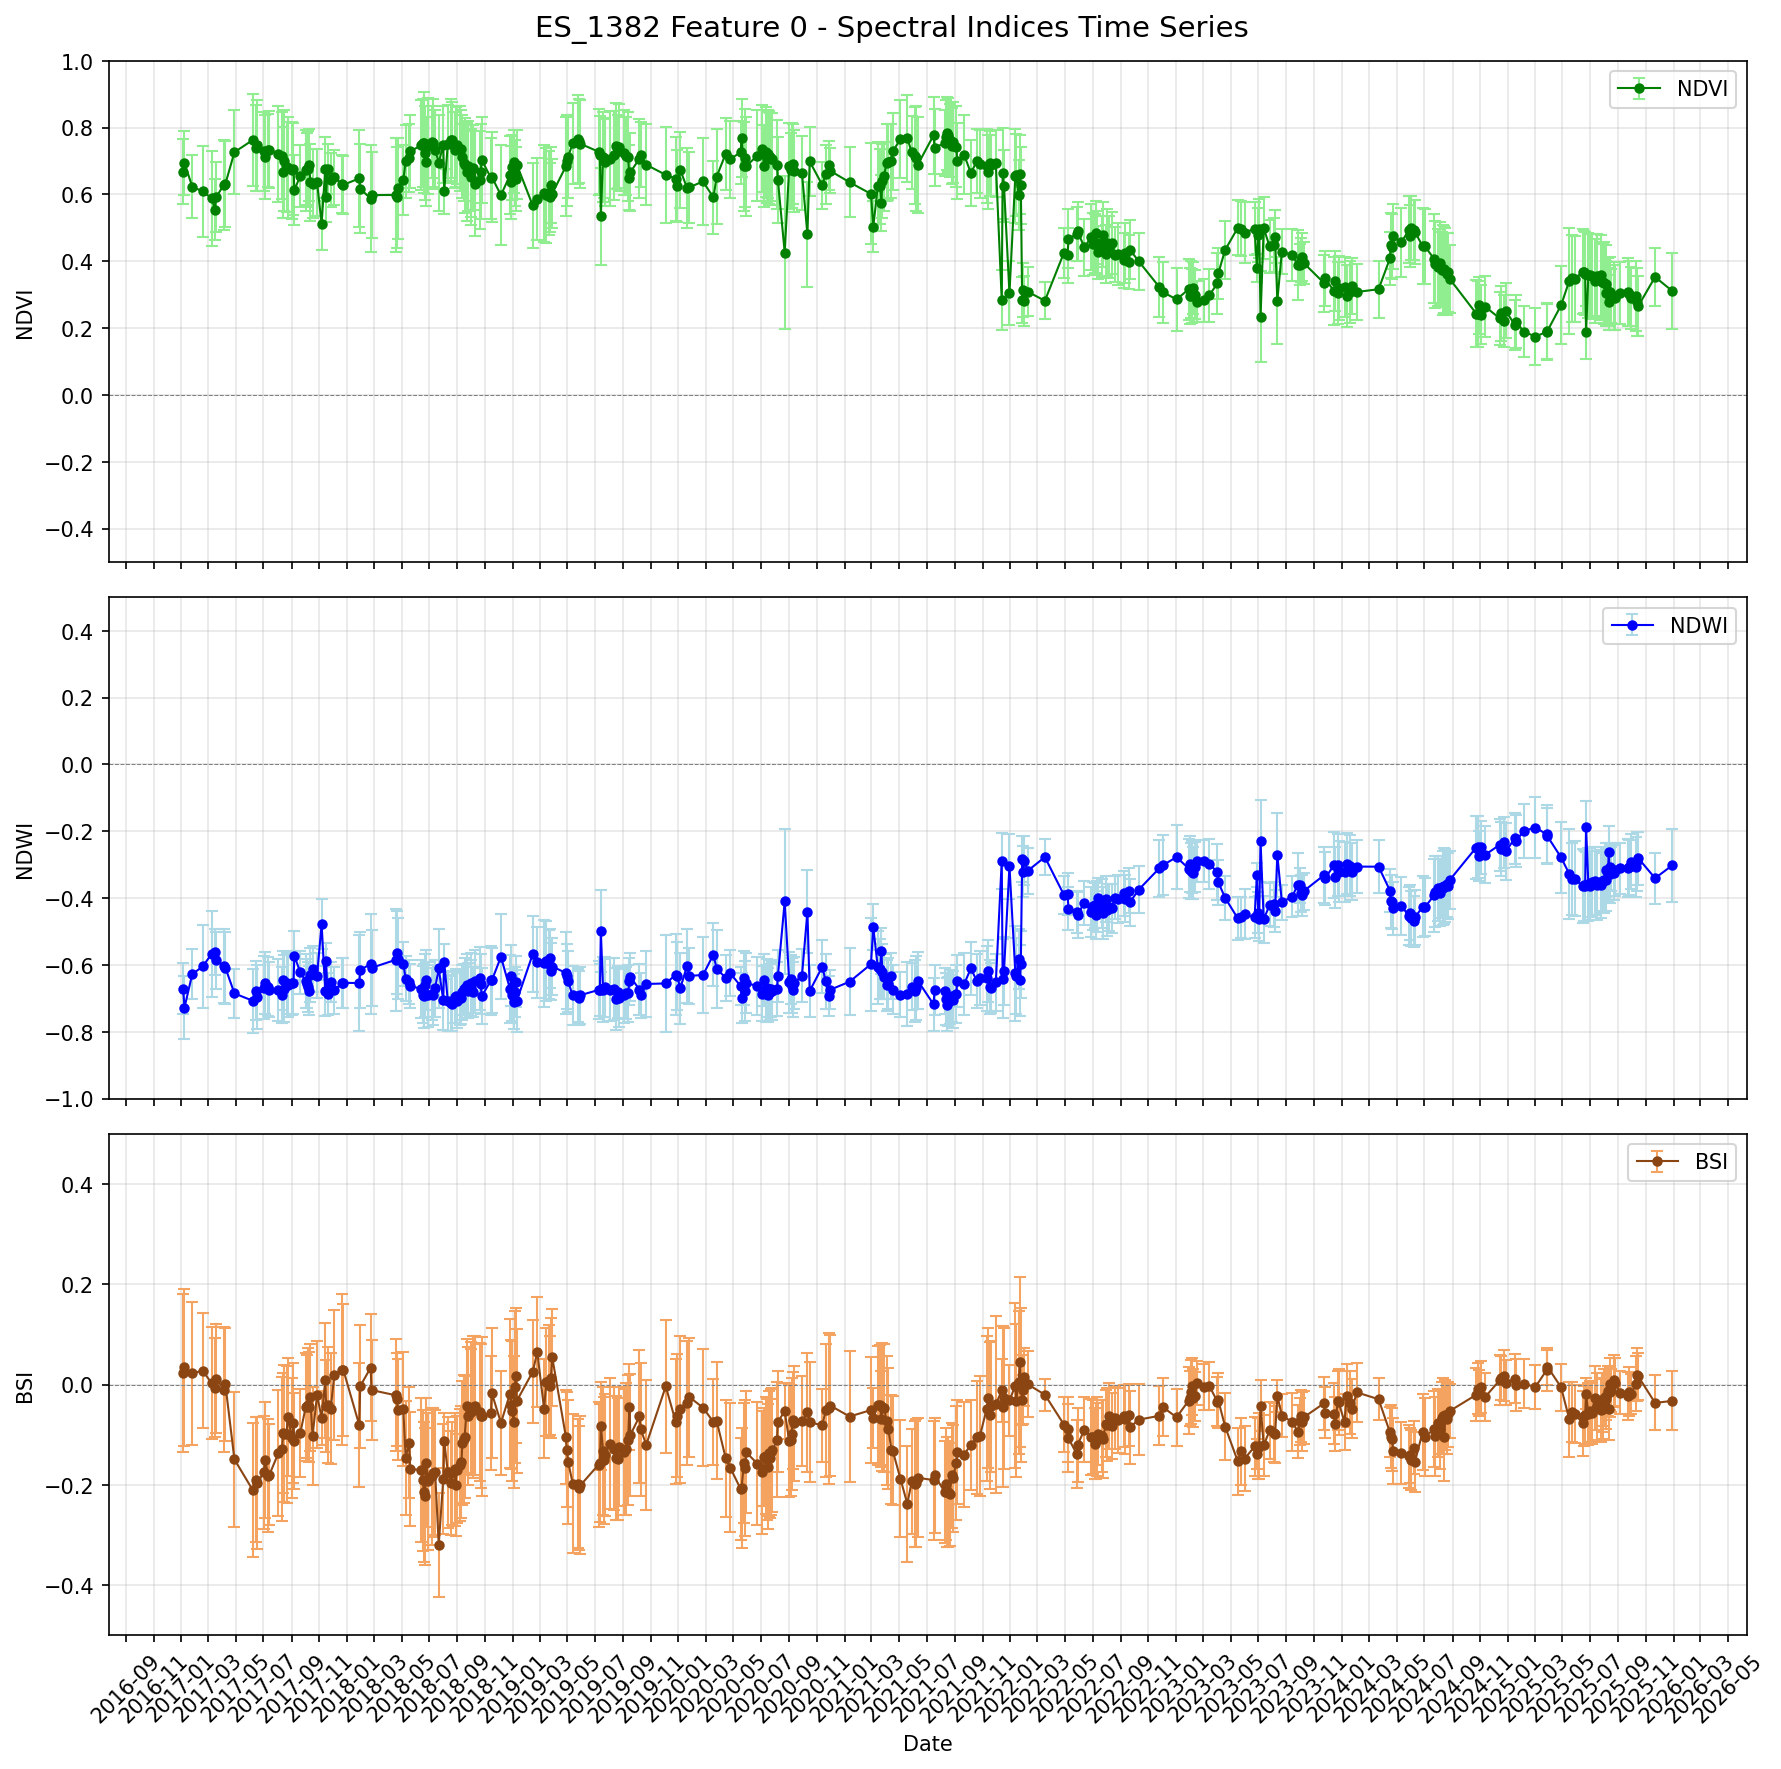
The engineered cap is visible. Between 2020 and 2025 NDVI falls 46.6%, consistent with the transition from a vegetated to an engineered surface. BSI rises accordingly, pointing to an exposed, stable surface.
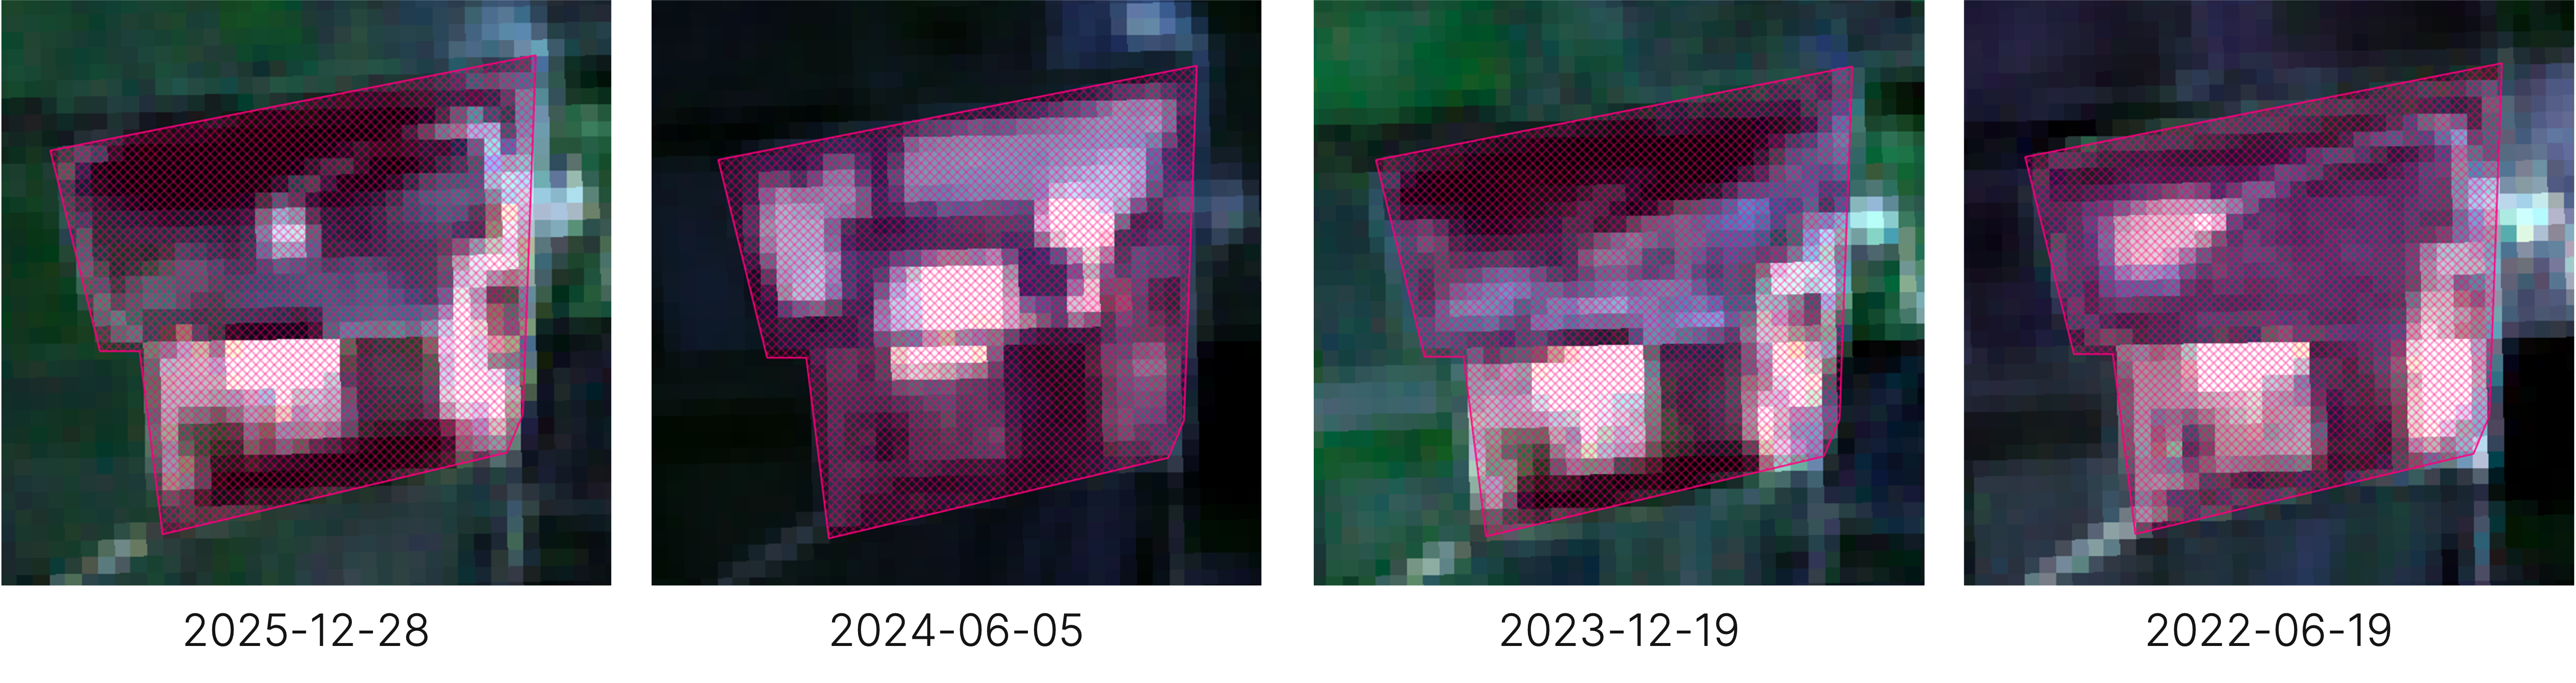
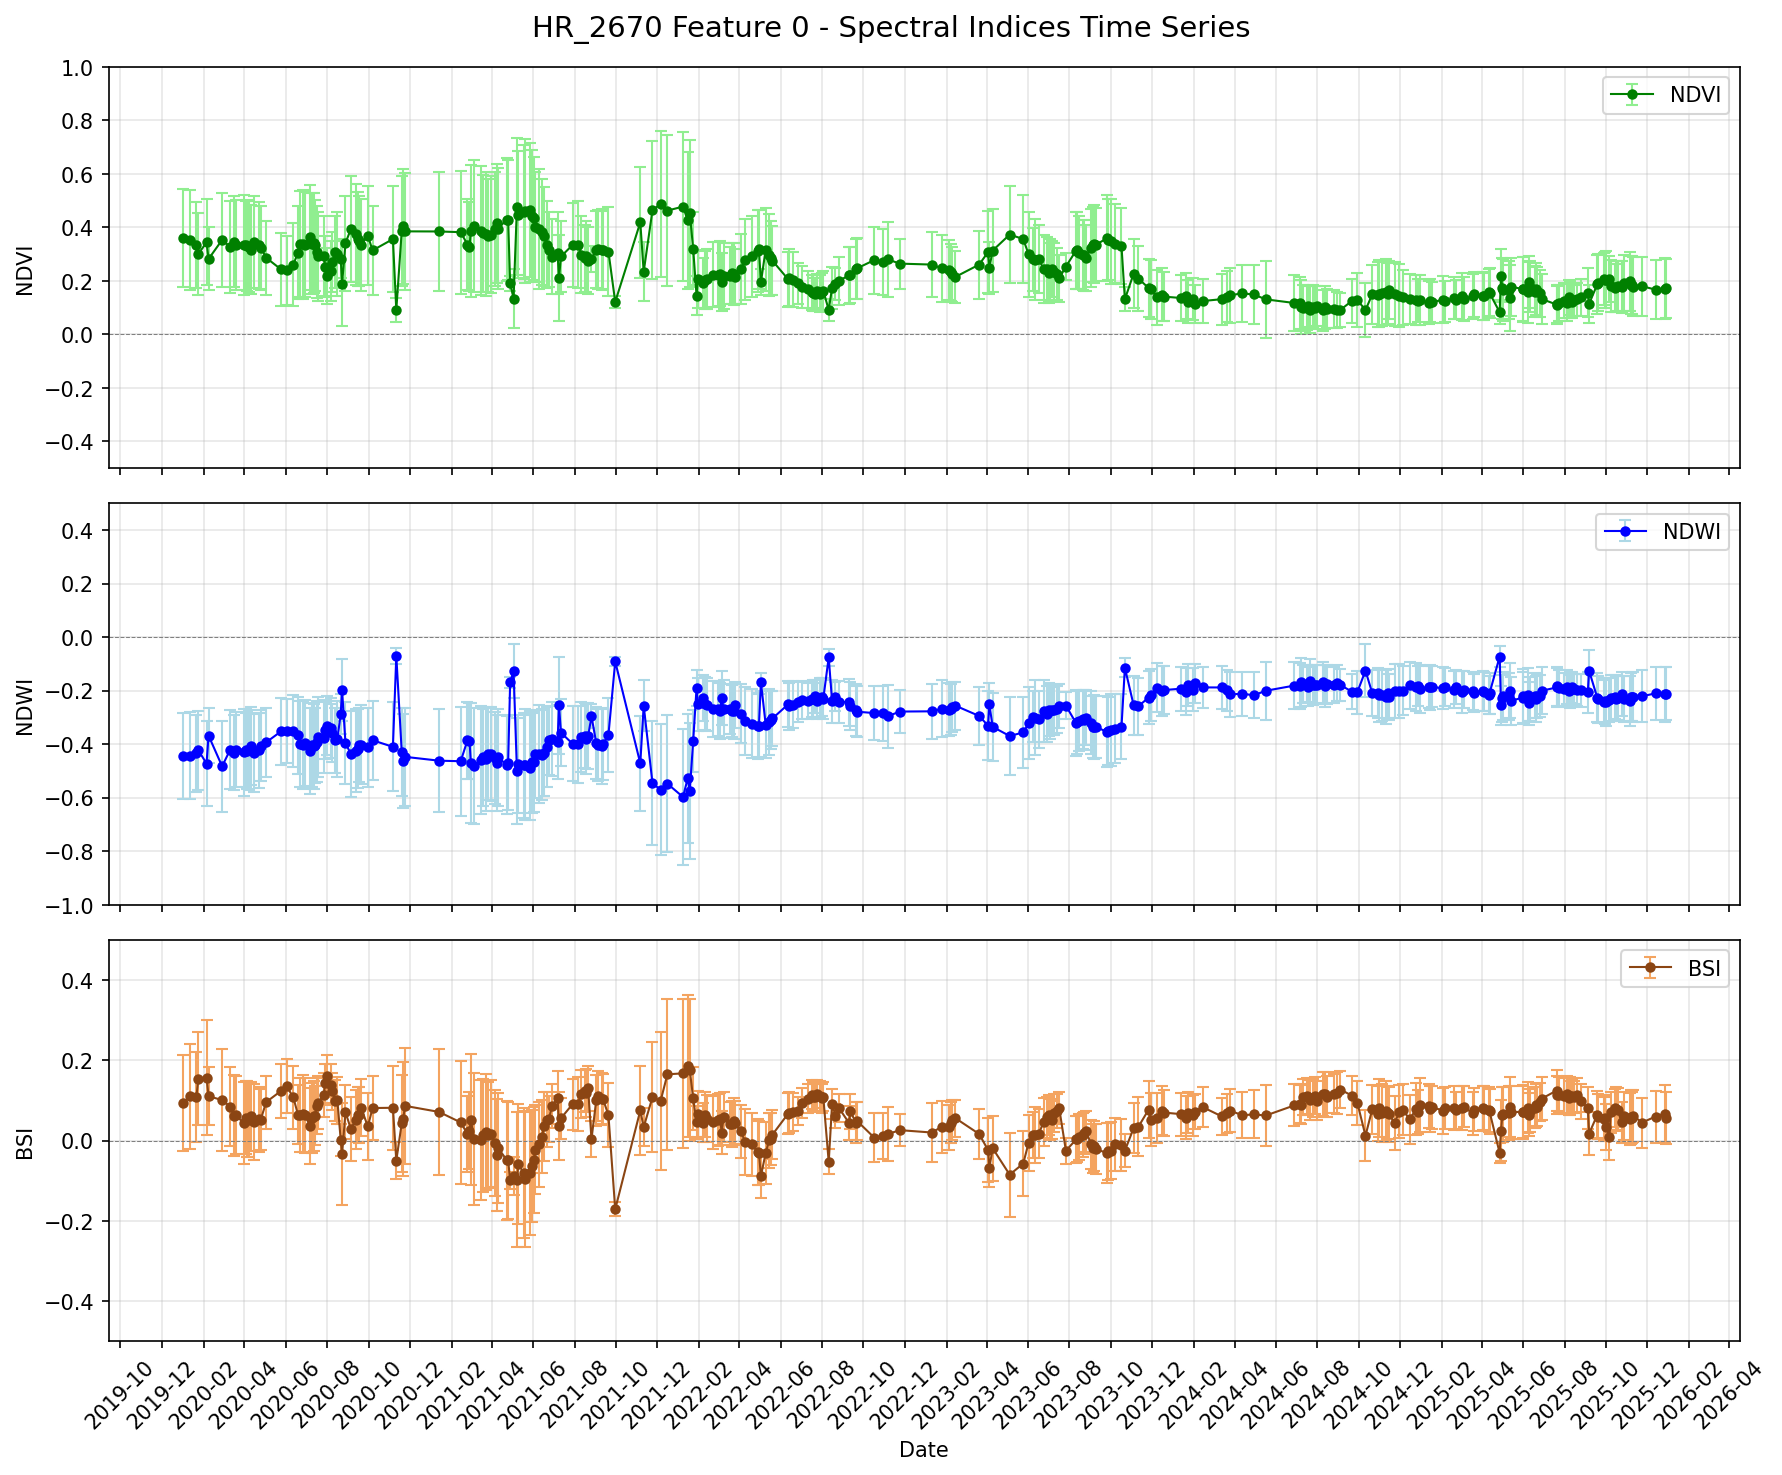
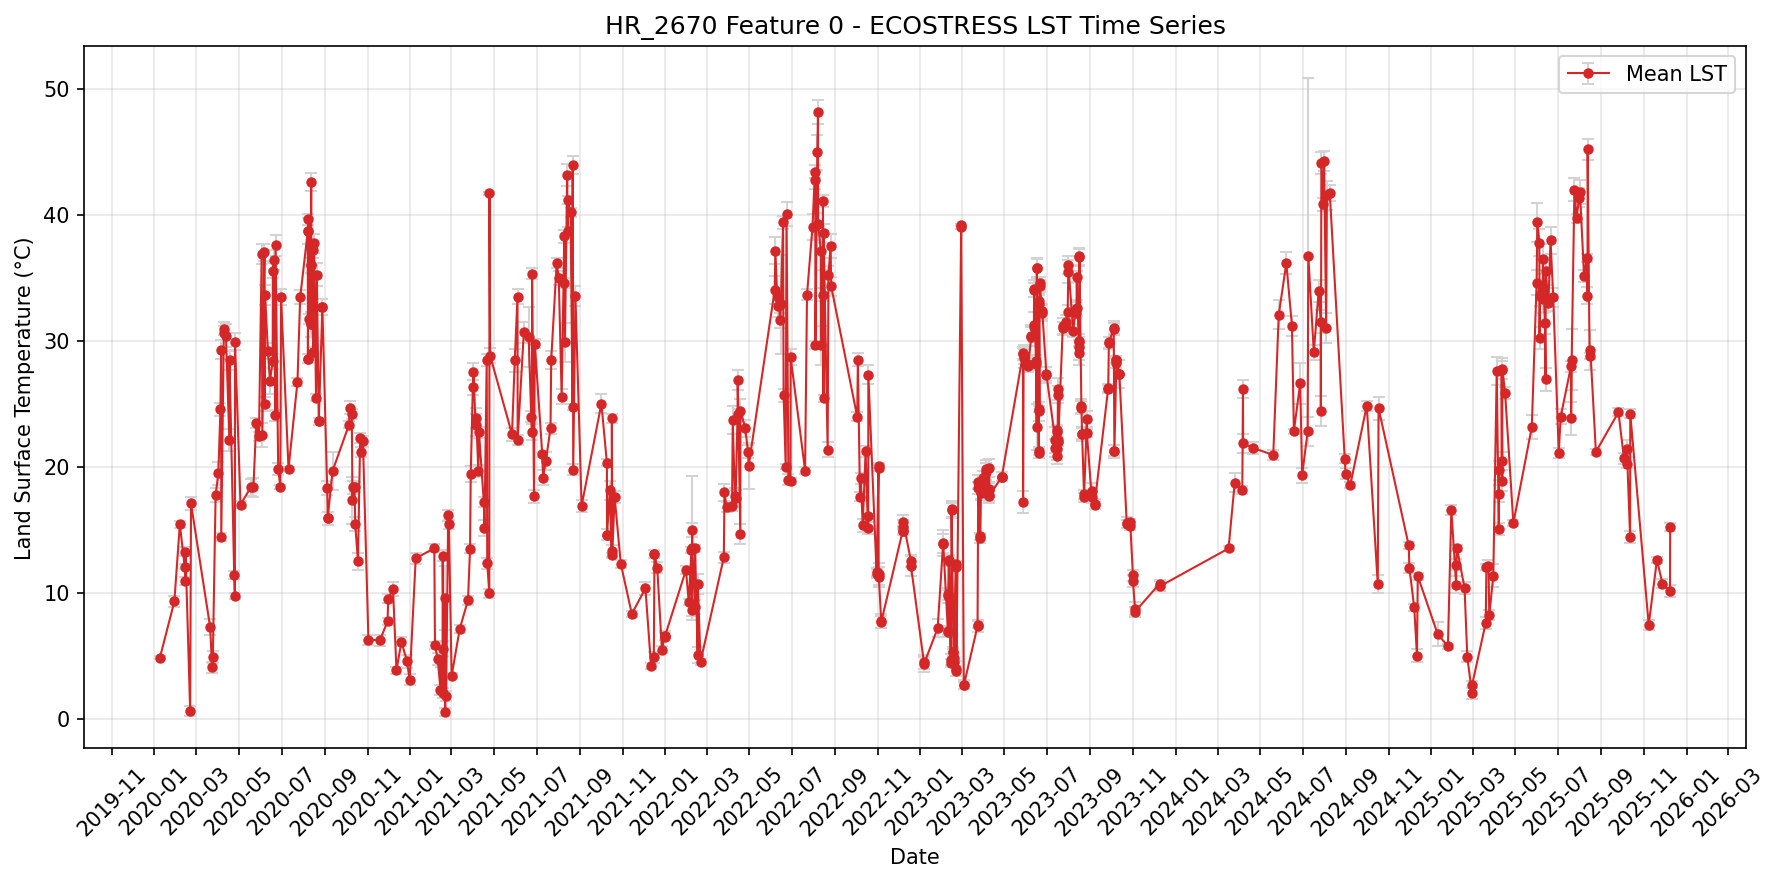
The land-surface temperature adds to the finding. The cap follows a seasonal temperature cycle but stands out warmer than a vegetated surrounding. That is consistent with an exposed engineered landfill cap. In the analysed vegetation and temperature data, no discernible ecological regeneration is visible so far.
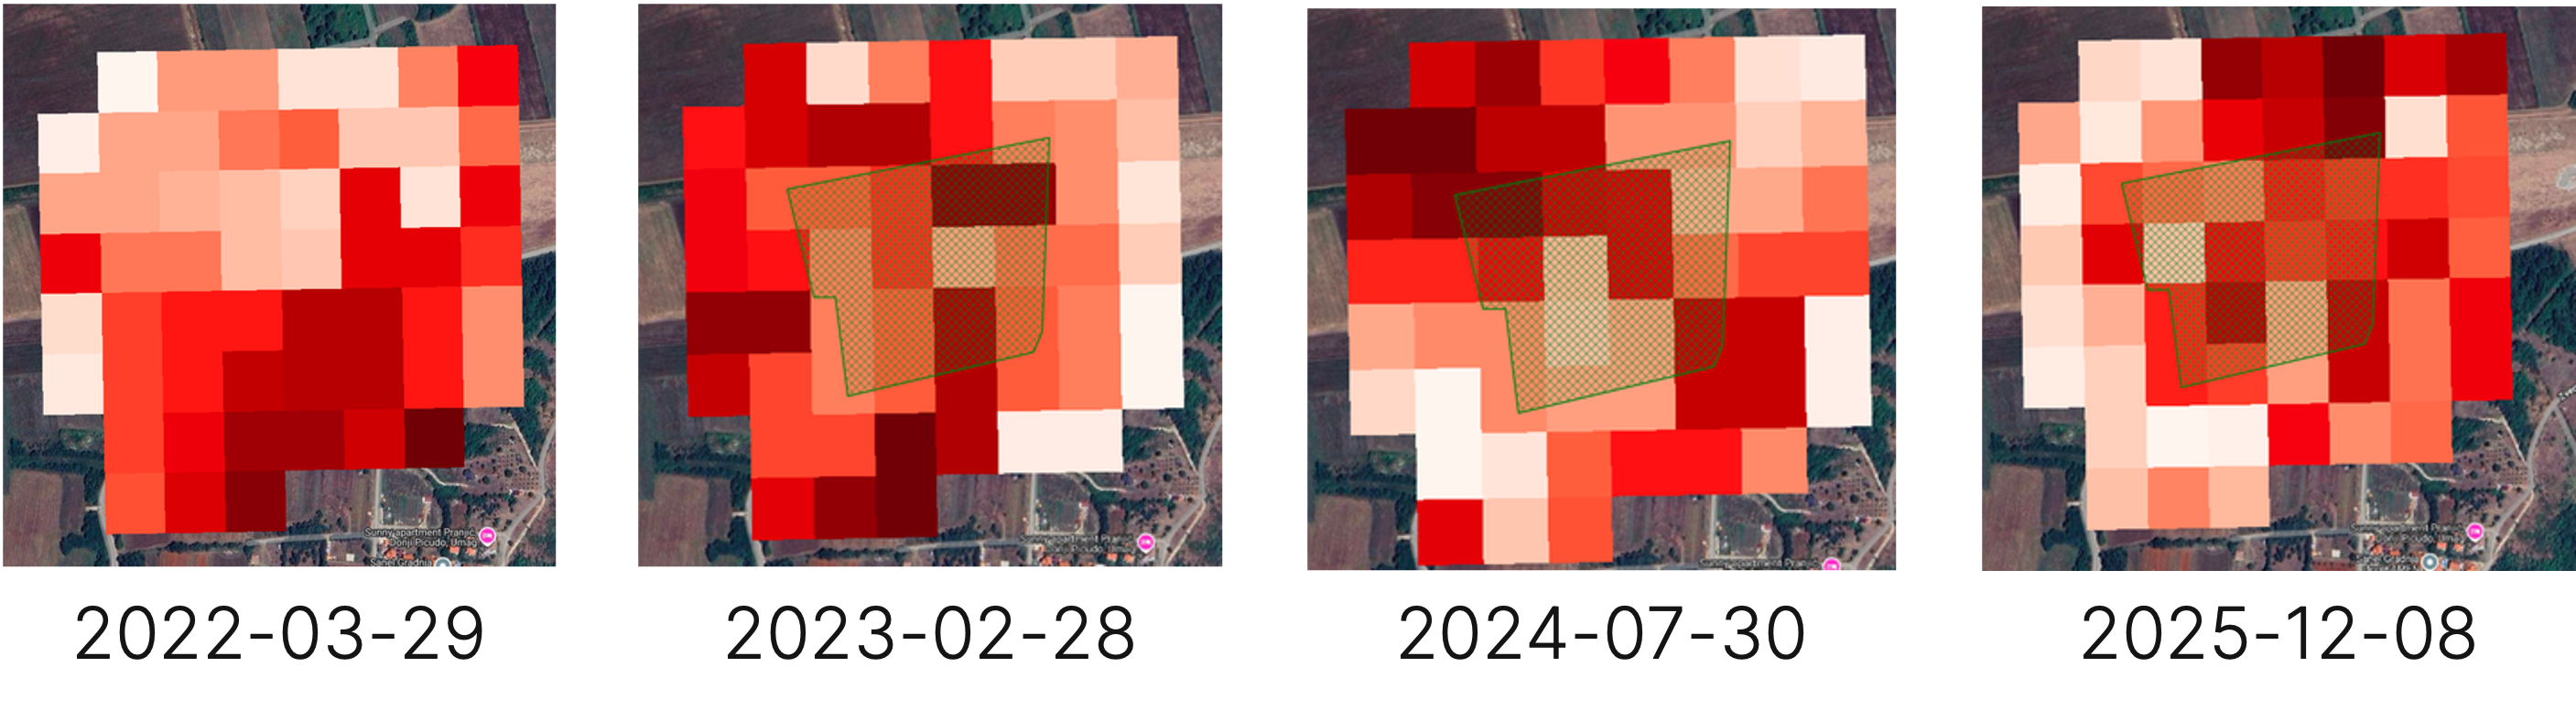
The engineered works are visibly complete. The ecological consequence that should usually follow a rehabilitated landfill cap — vegetation build-up and a cooling of the surface — is not yet detectable in the analysed data. The finding is therefore not a binary assessment but a differentiated partial finding: technically implemented, ecologically still open.
Three out of 5,705
These three sites are a sample. They show how differently a data-based ground finding can turn out: a discernible discrepancy between project status and satellite image, a clear confirmation, and a partial result where the engineering is visible but the ecological development is not yet.
The same pipeline can be applied to every project for which a site or an area can be located. It pulls a multi-year satellite series over a project's footprint and measures which changes are visible at the site.
The method has limits, and they are stated explicitly. Some outcomes sit below what these satellites resolve: a single refurbished building, a process change inside a factory hall, a technical component inside a facility. Where the spatial, spectral or temporal resolution does not allow a reliable statement, no finding is claimed.
What it's good for
Each of these projects comes with a reported status: complete, under way or delivered. Independent satellite data test that status against visible changes at the site. The three cases show the range of possible outcomes: a clear confirmation in Spain, a visible gap between reported completion and satellite finding in France, a partial result in Croatia.
For investors and data providers, green-bond reporting is enriched with location-based evidence. For banks, insurers and auditors, it produces plausibility indicators, documented site findings and pointers to where deeper review is needed, before a project status becomes a basis for decisions. For funding bodies, it creates an independent monitoring layer across large project portfolios.
The result is a traceable stream of evidence: from the raw acquisition, through the measurement logic, to the documented finding. It does not rest on project self-reporting alone, but complements it with independent, dated observations.
When a project status becomes a basis for decisions?
We check single sites or whole portfolios against the satellite record — traceable from the raw acquisition to the finding.
Talk to usMethods & sources
The analysis uses Sentinel-2 imagery with spectral indices such as NDVI, NDWI and BSI, the ECOSTRESS land-surface temperature and a high-resolution digital elevation model with a HAND-based flood screening.
These are deterministic remote-sensing measurements. No machine-learning models are involved.
Where the data support only a tendency, the wording is "consistent with," not "proven." The flood layer is topographic screening, not a hydraulic model. That restraint is part of the method.
Programme figures: NextGenerationEU Green Bonds, 2024 reporting period, European Commission.
Supported by AWS, austria wirtschaftsservice, FFG, XPLORE, the NVIDIA Inception Program and Google for Startups.
LuLarge is the Earth-observation data service of Open Beta.
One lean stream of evidence — transparent, traceable, analysis-ready.